You can now track Tenderly Unit (TU) usage and identify consumption trends over time to better understand your team’s infrastructure needs and map costs to actual usage.
Get granular, transparent insights into your TU usage across Tenderly’s infrastructure components, including Node RPC, Virtual TestNets, and Simulation API. Dig even deeper into consumption by creating custom views per data type.
Here’s how to dive into your team’s TU usage.
Overview on the Billing page
Get a clear TU usage breakdown on the Billing page to analyze consumption within your plan when managing costs. Identify which infrastructural components use the most TUs, as well as what caused overages in your plan to see whether you may need to upgrade your plan or optimize usage spending.
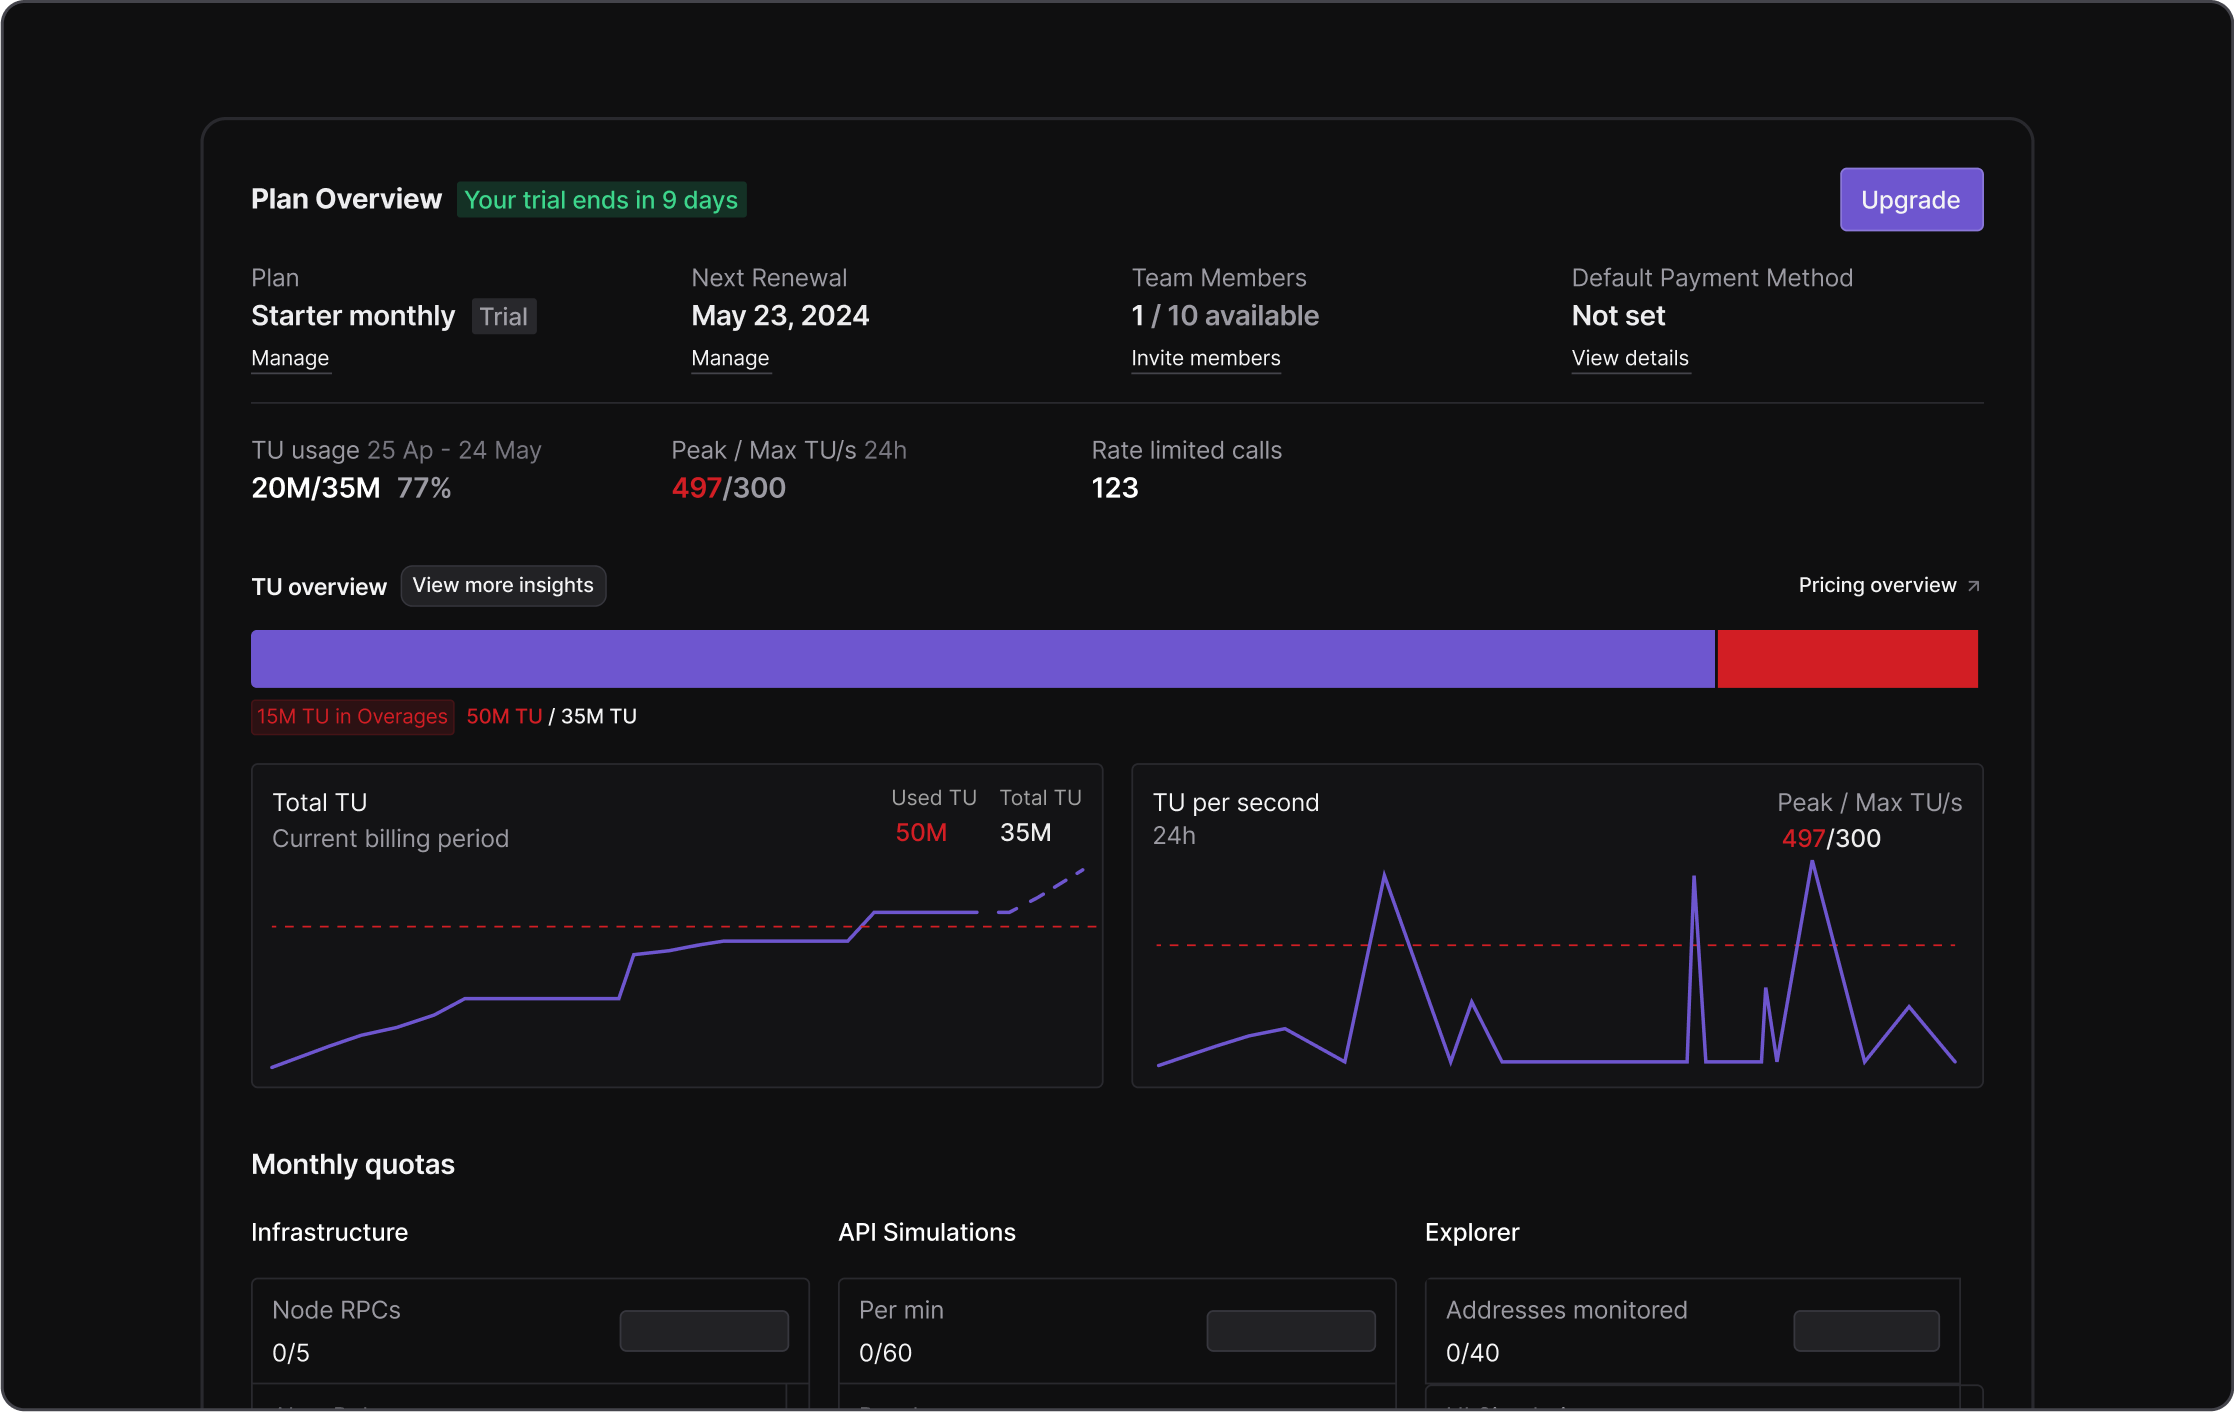
Continue your analysis with a visual overview of your total TU usage and TU/s for your current billing period.
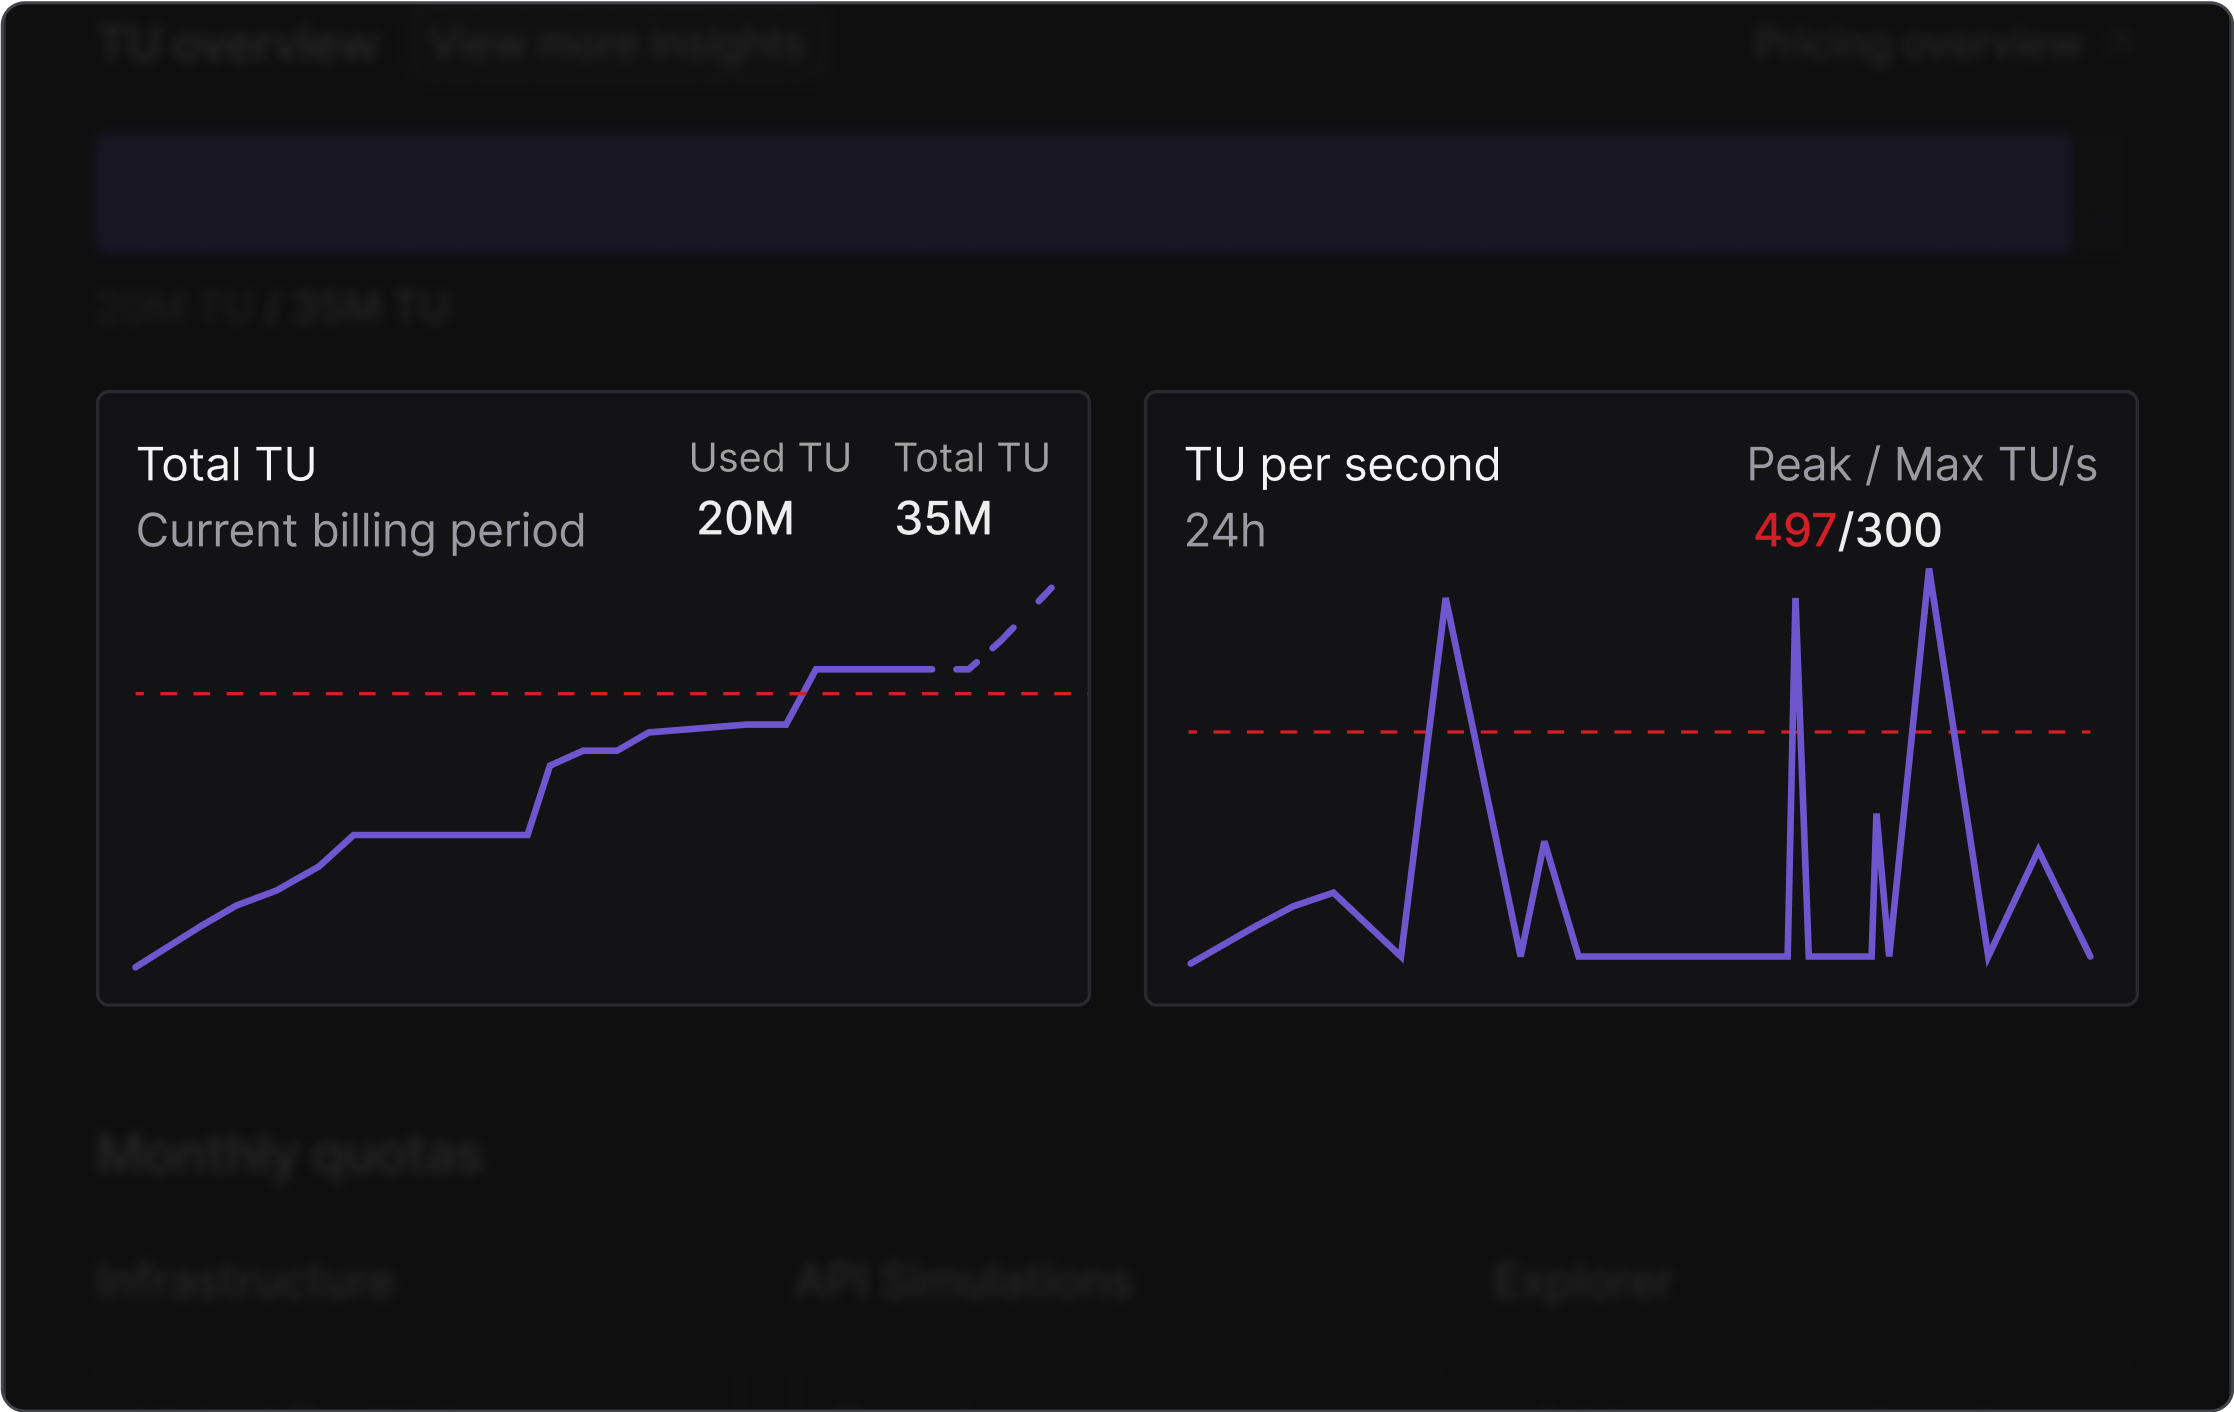
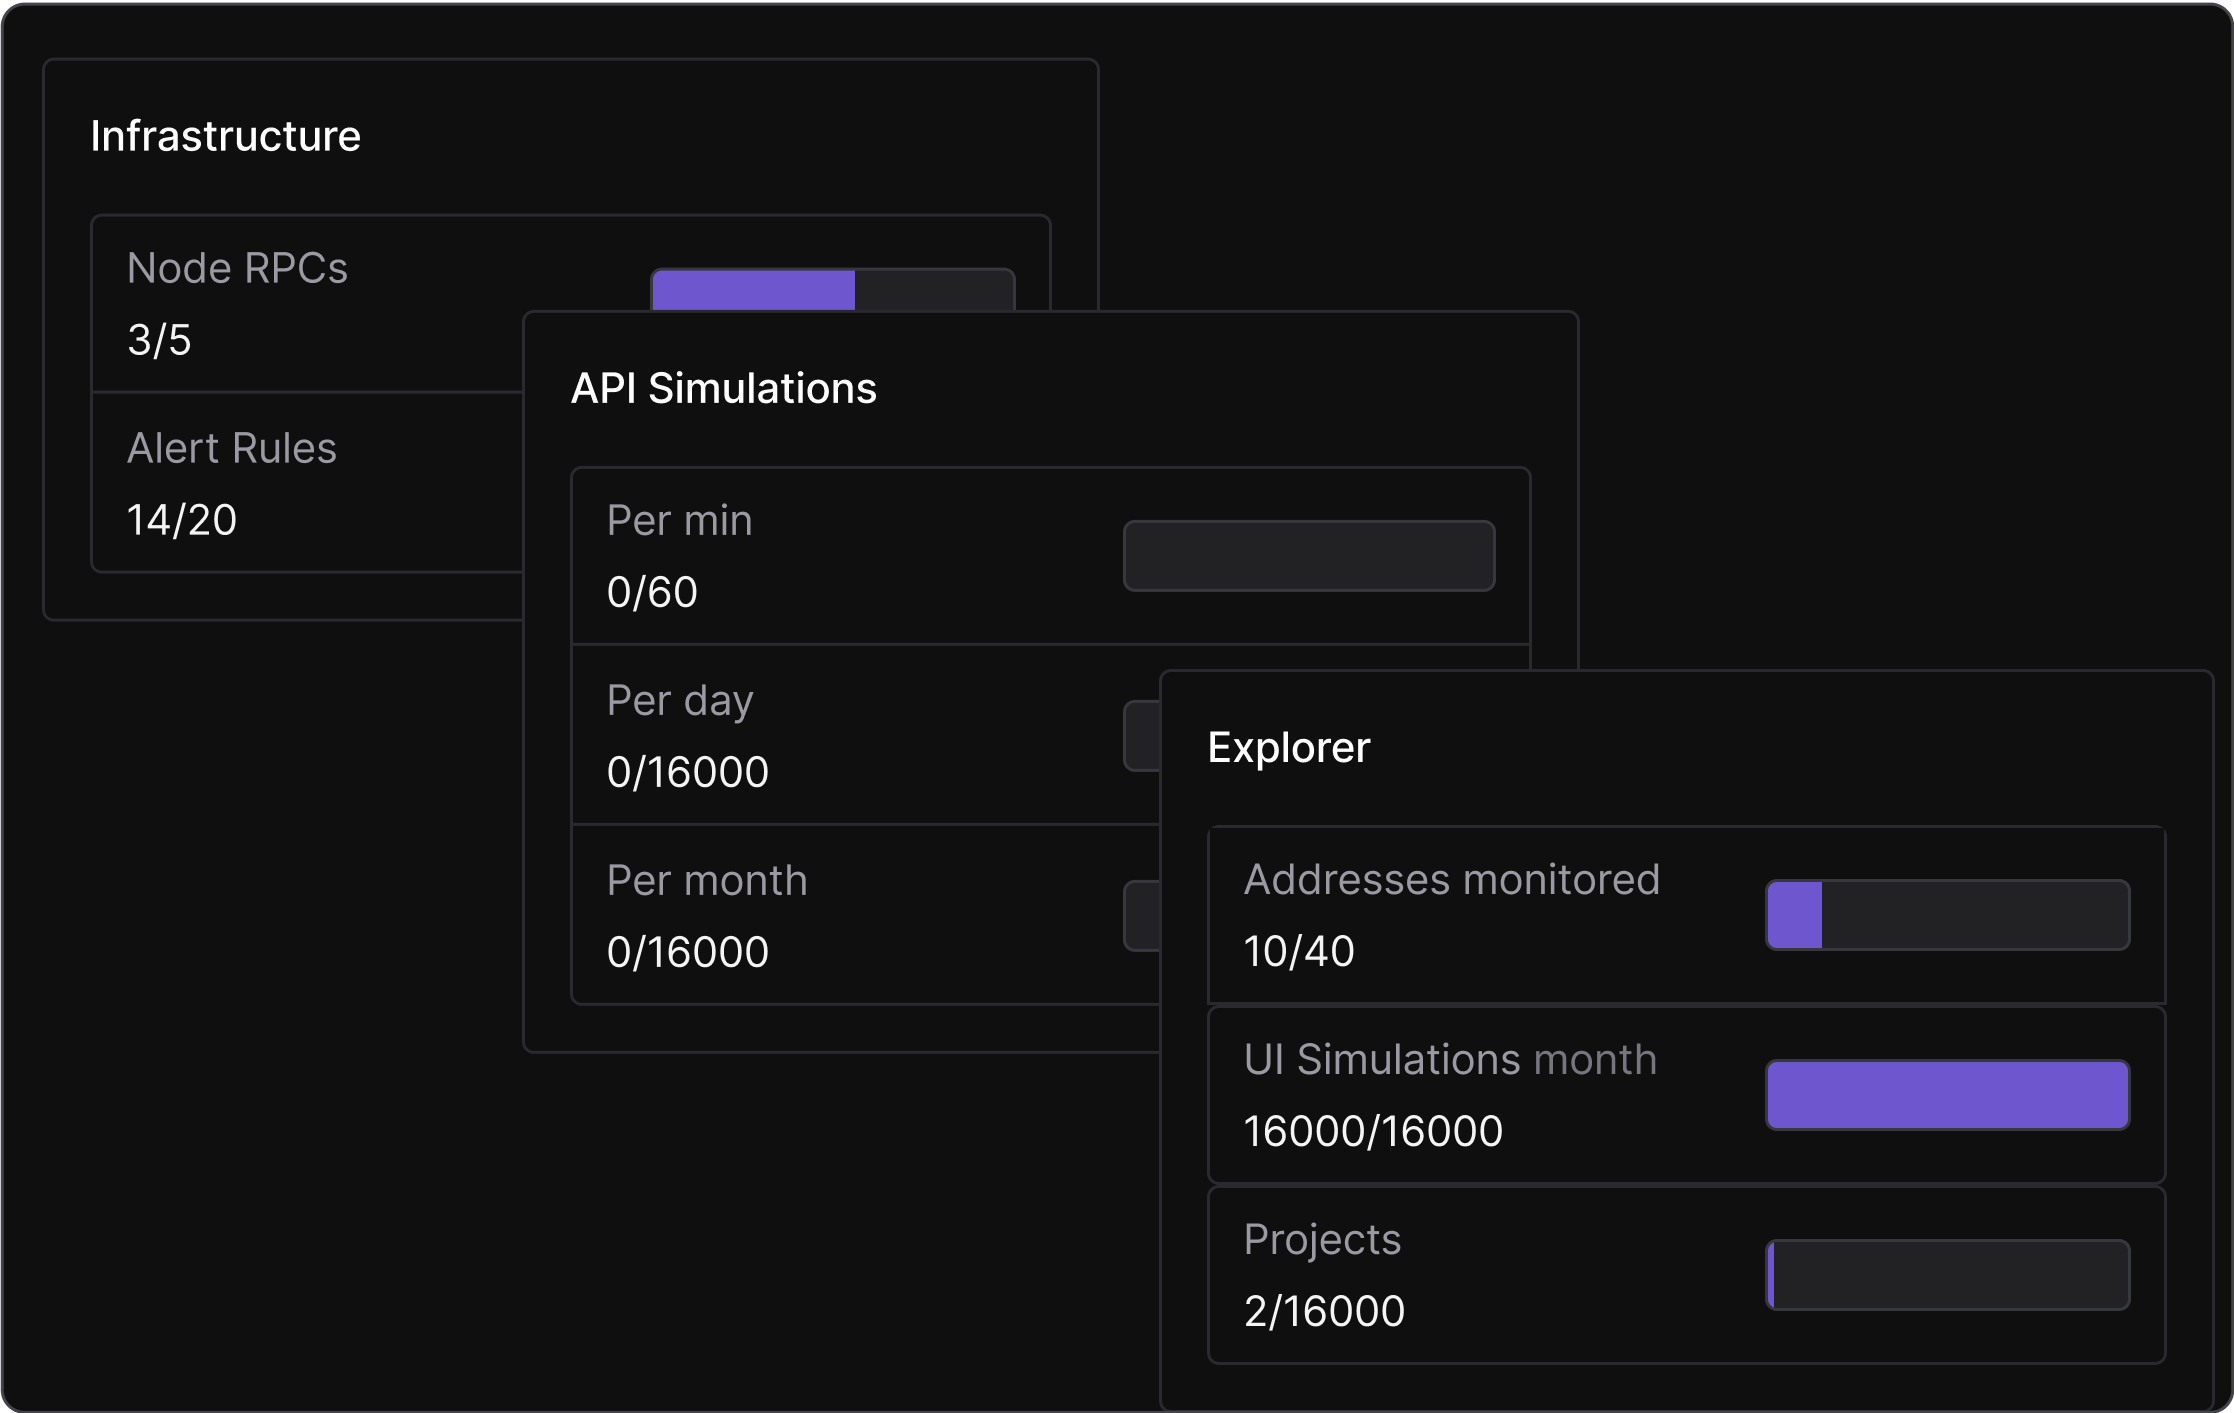
Here, you can also see whether your team has used all of the quotas within your plan, identifying potential areas where you have unused resources.
TU usage deep-dive
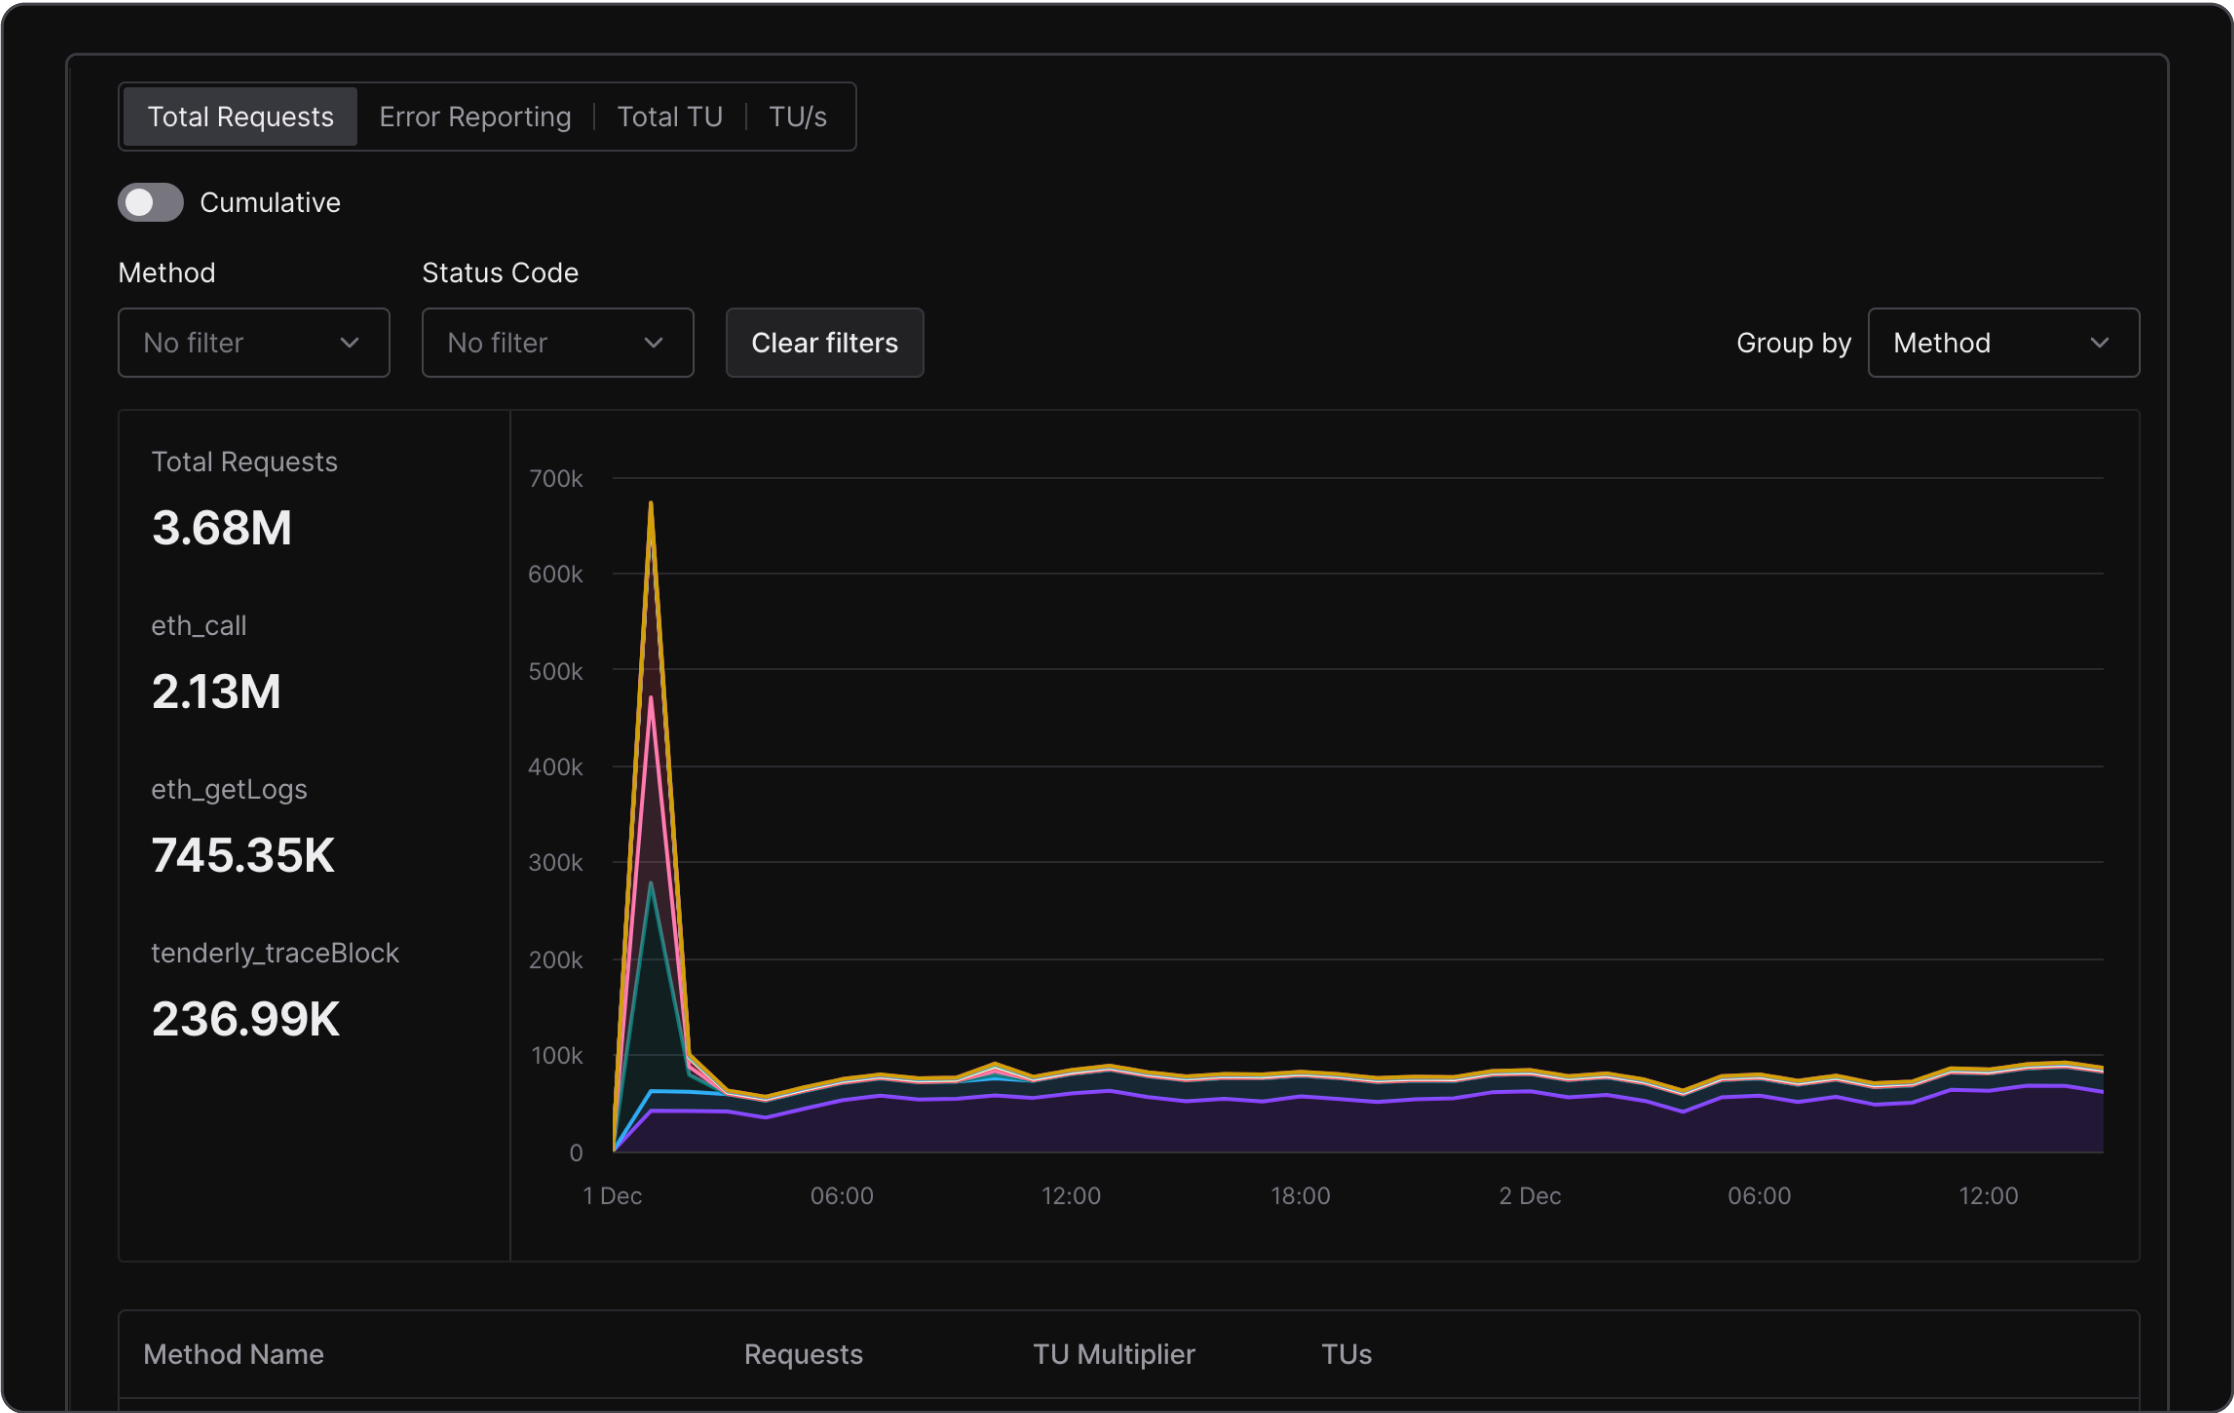
Once you open the TU Usage page within your Organization, you can segment and analyze data by total TU usage or TU/s.
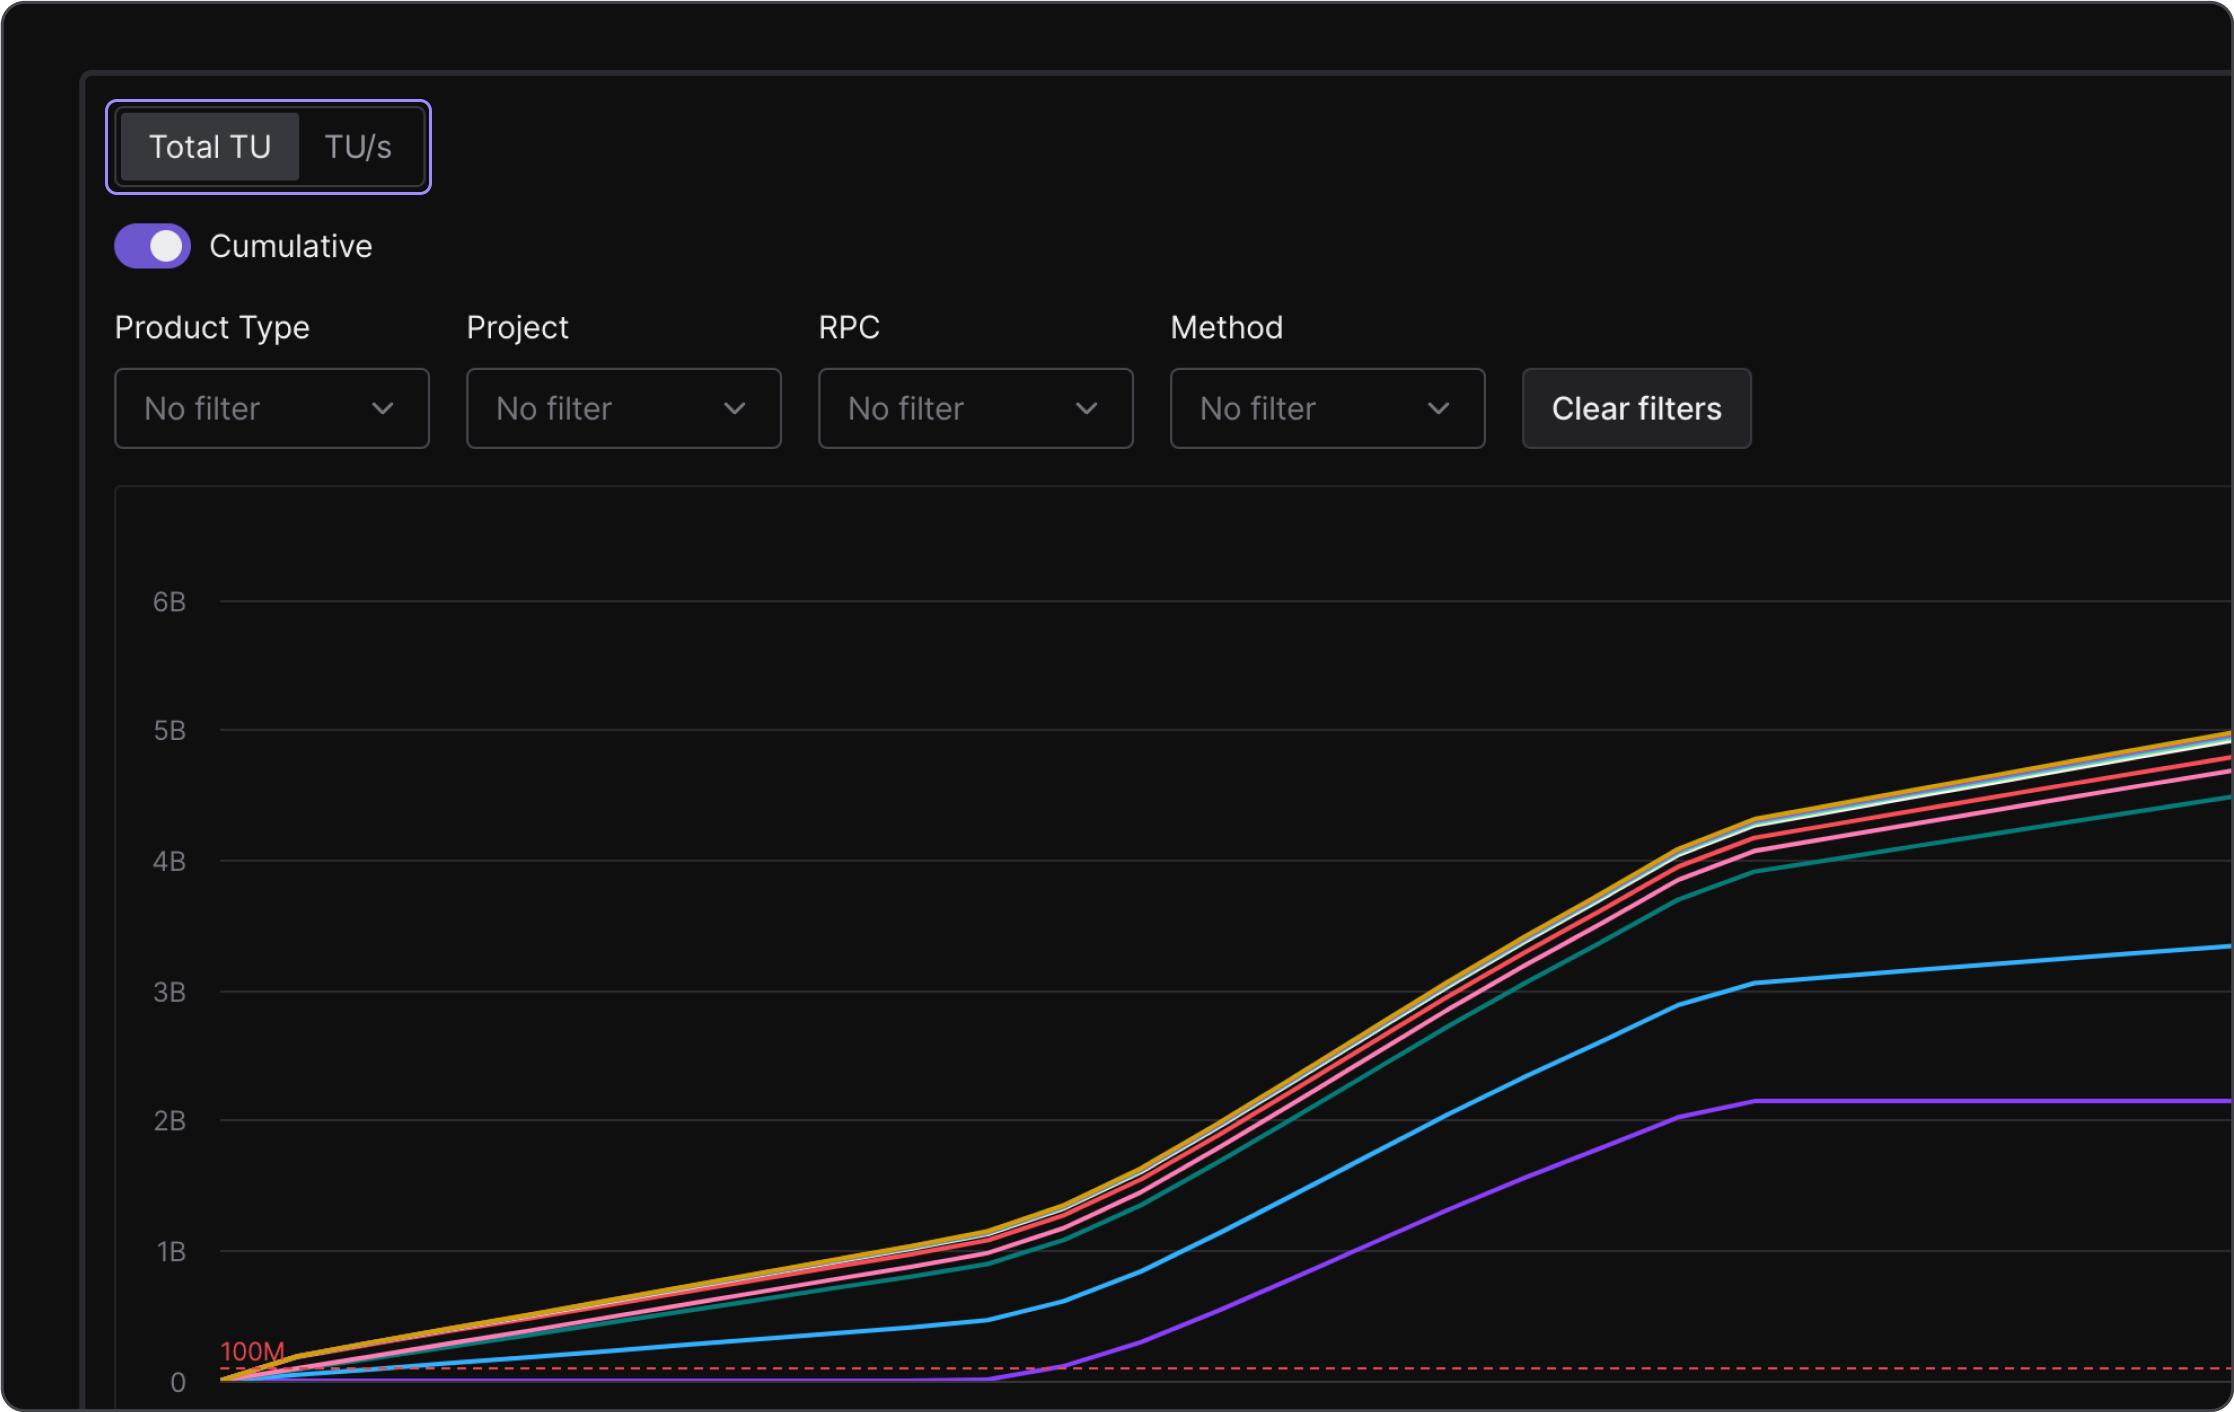
You can also filter usage by specific product, RPC, and even method, choosing whether to show cumulative values or values for a particular point in time.
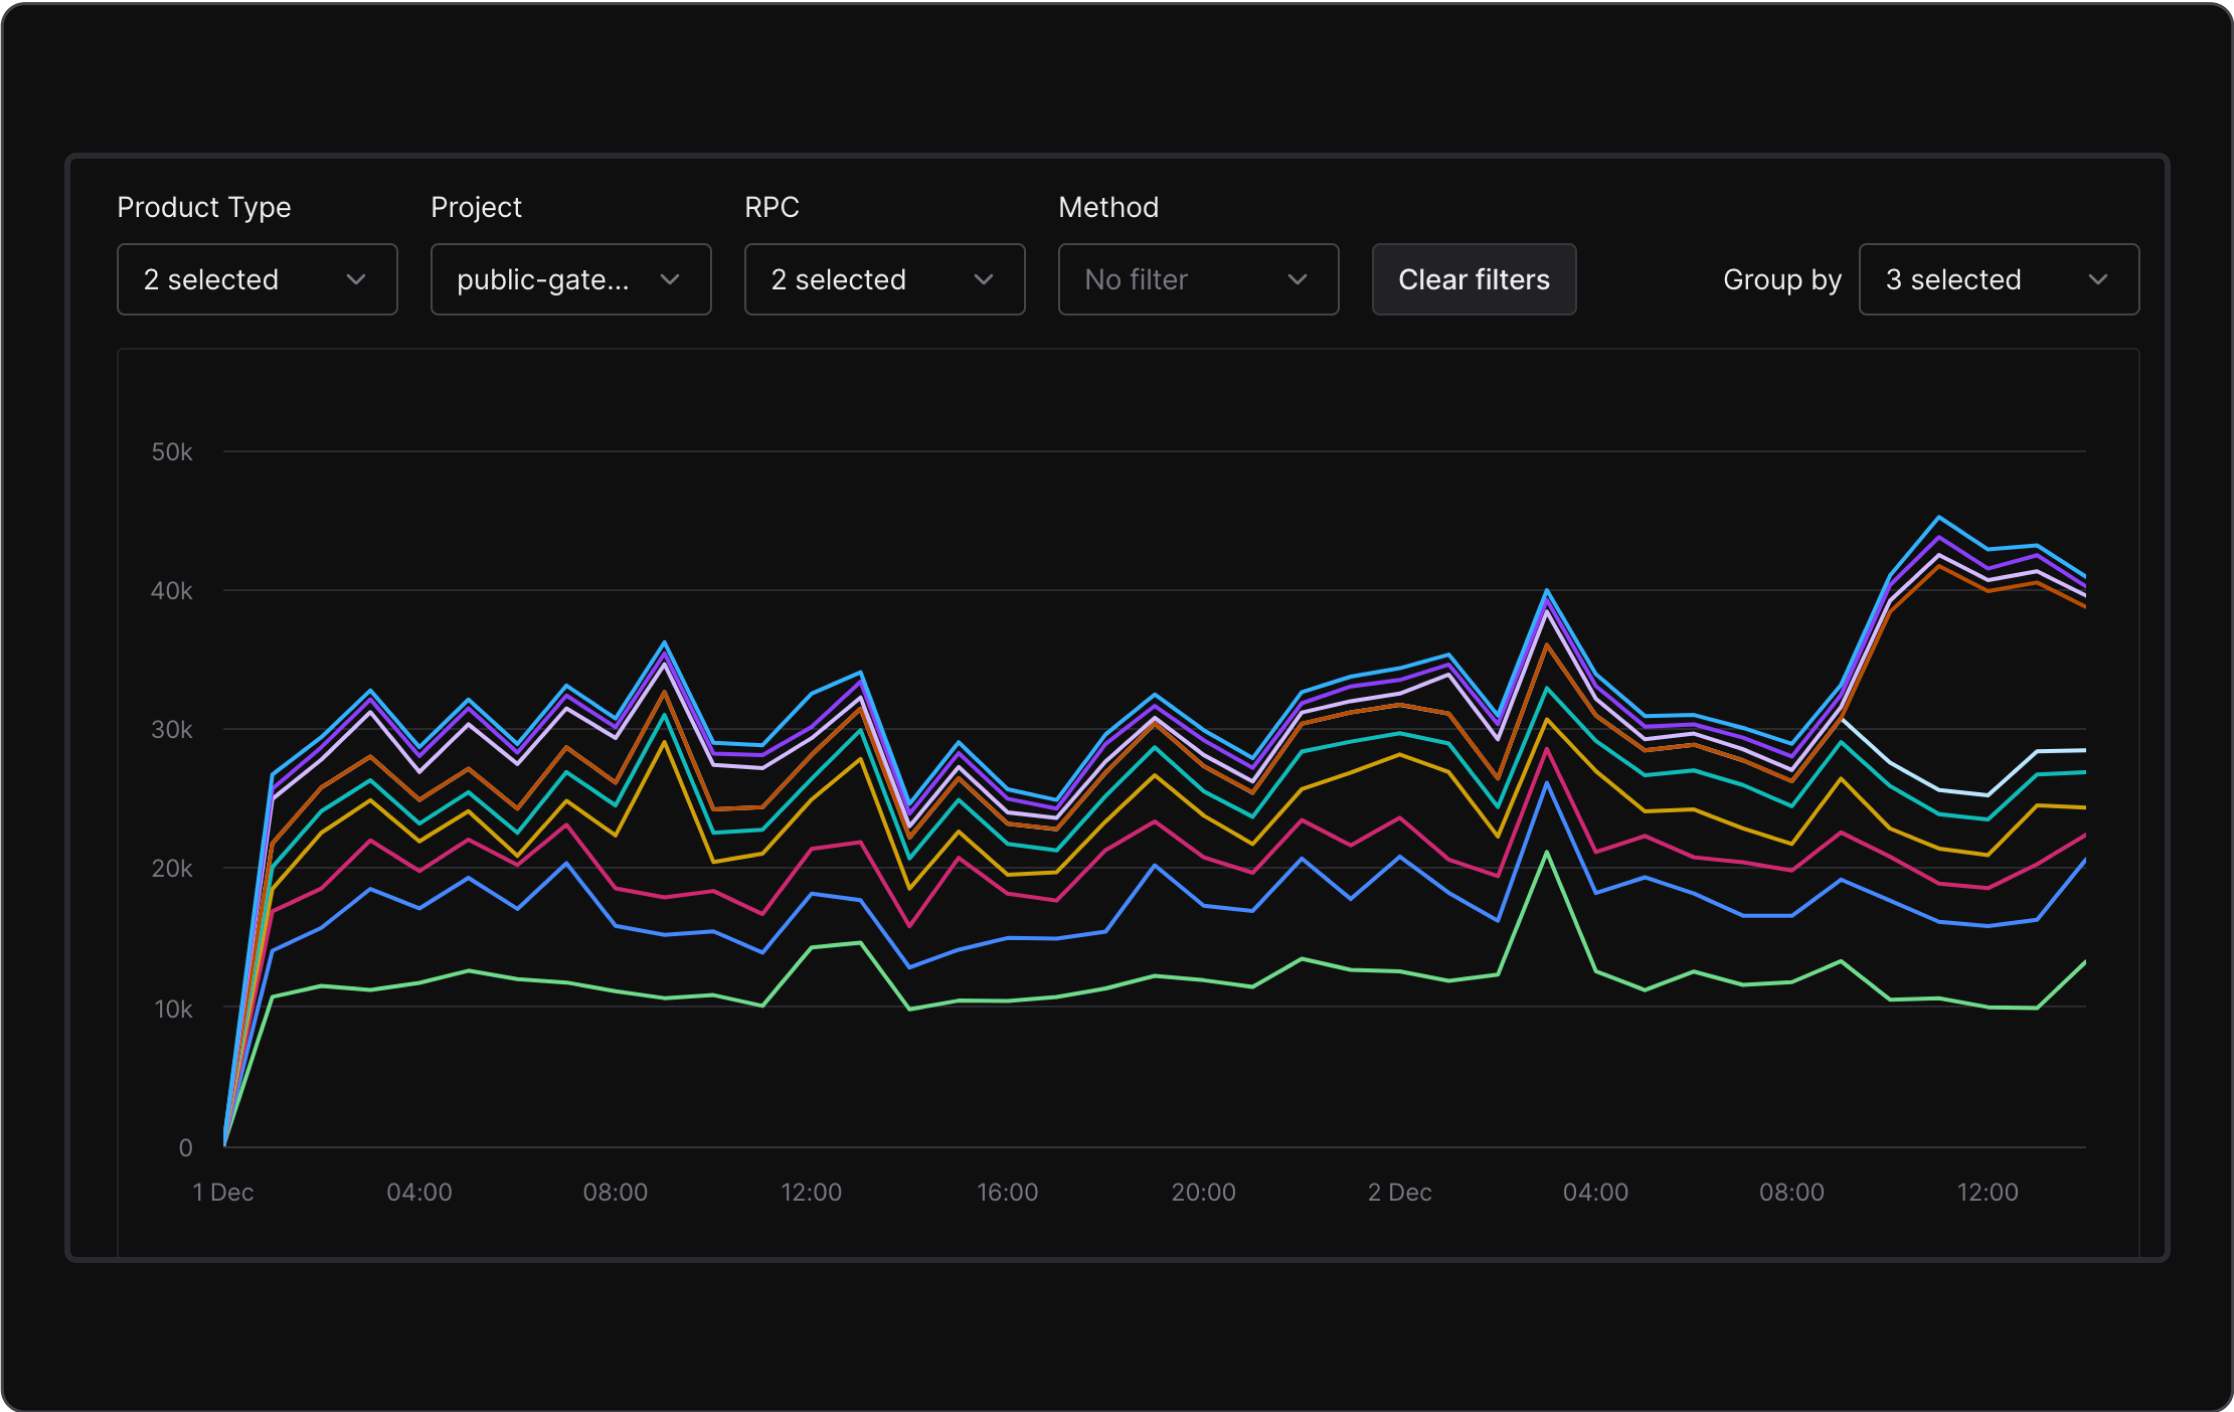
You can group data by multiple parameters such as project, product type, methods, and RPCs.
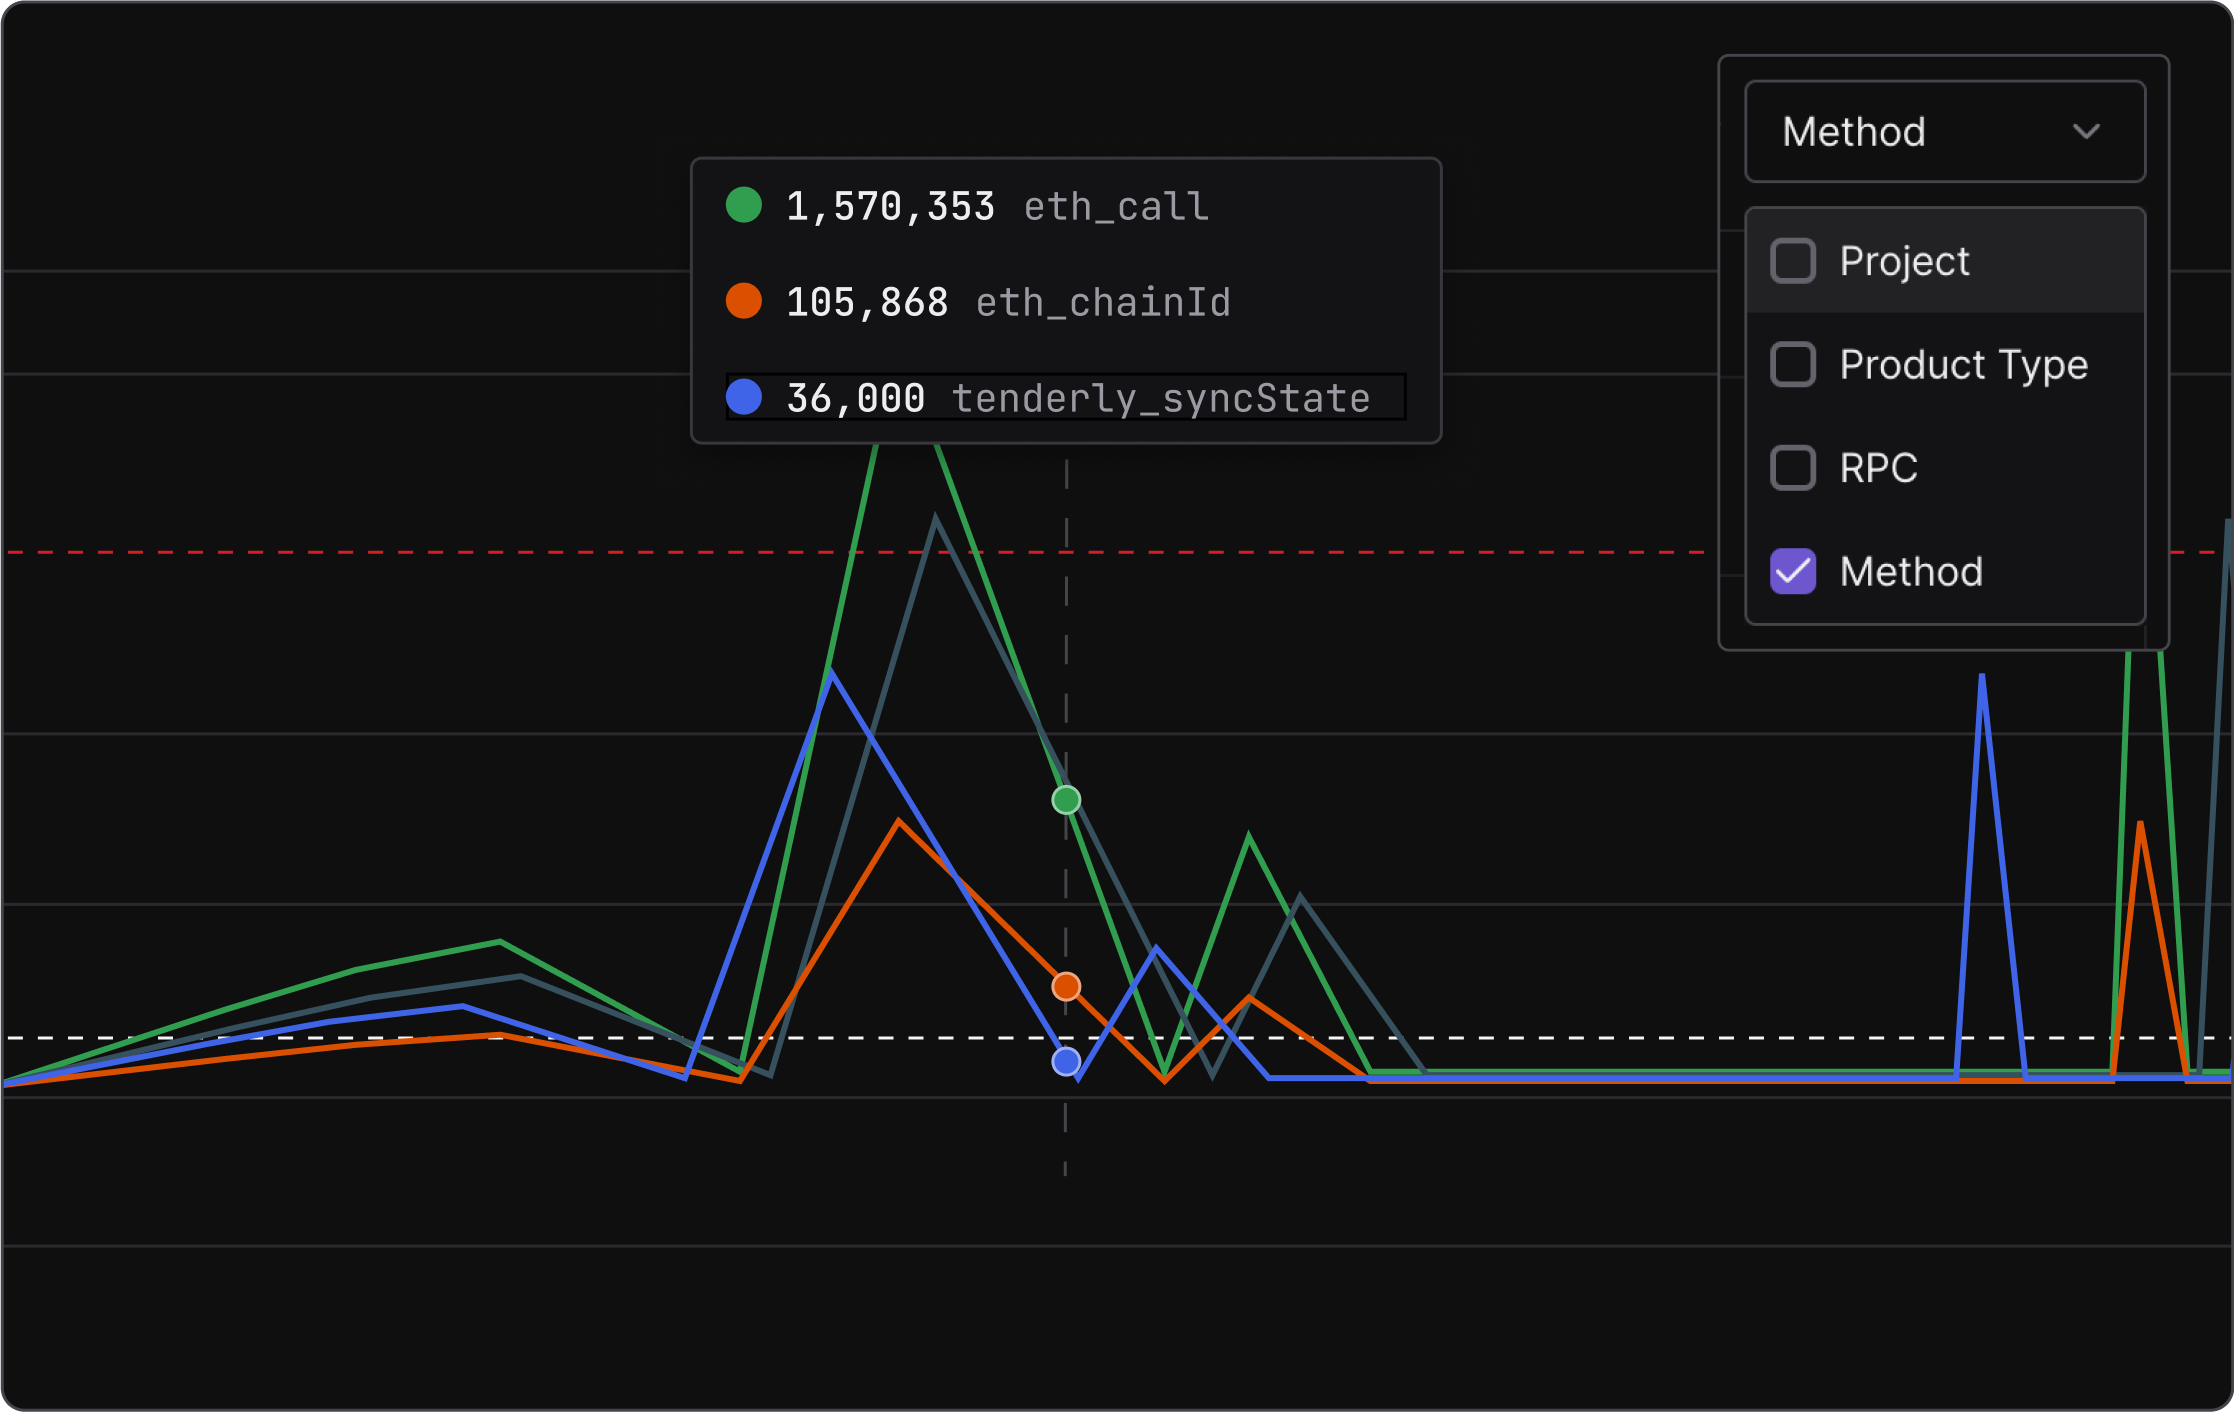
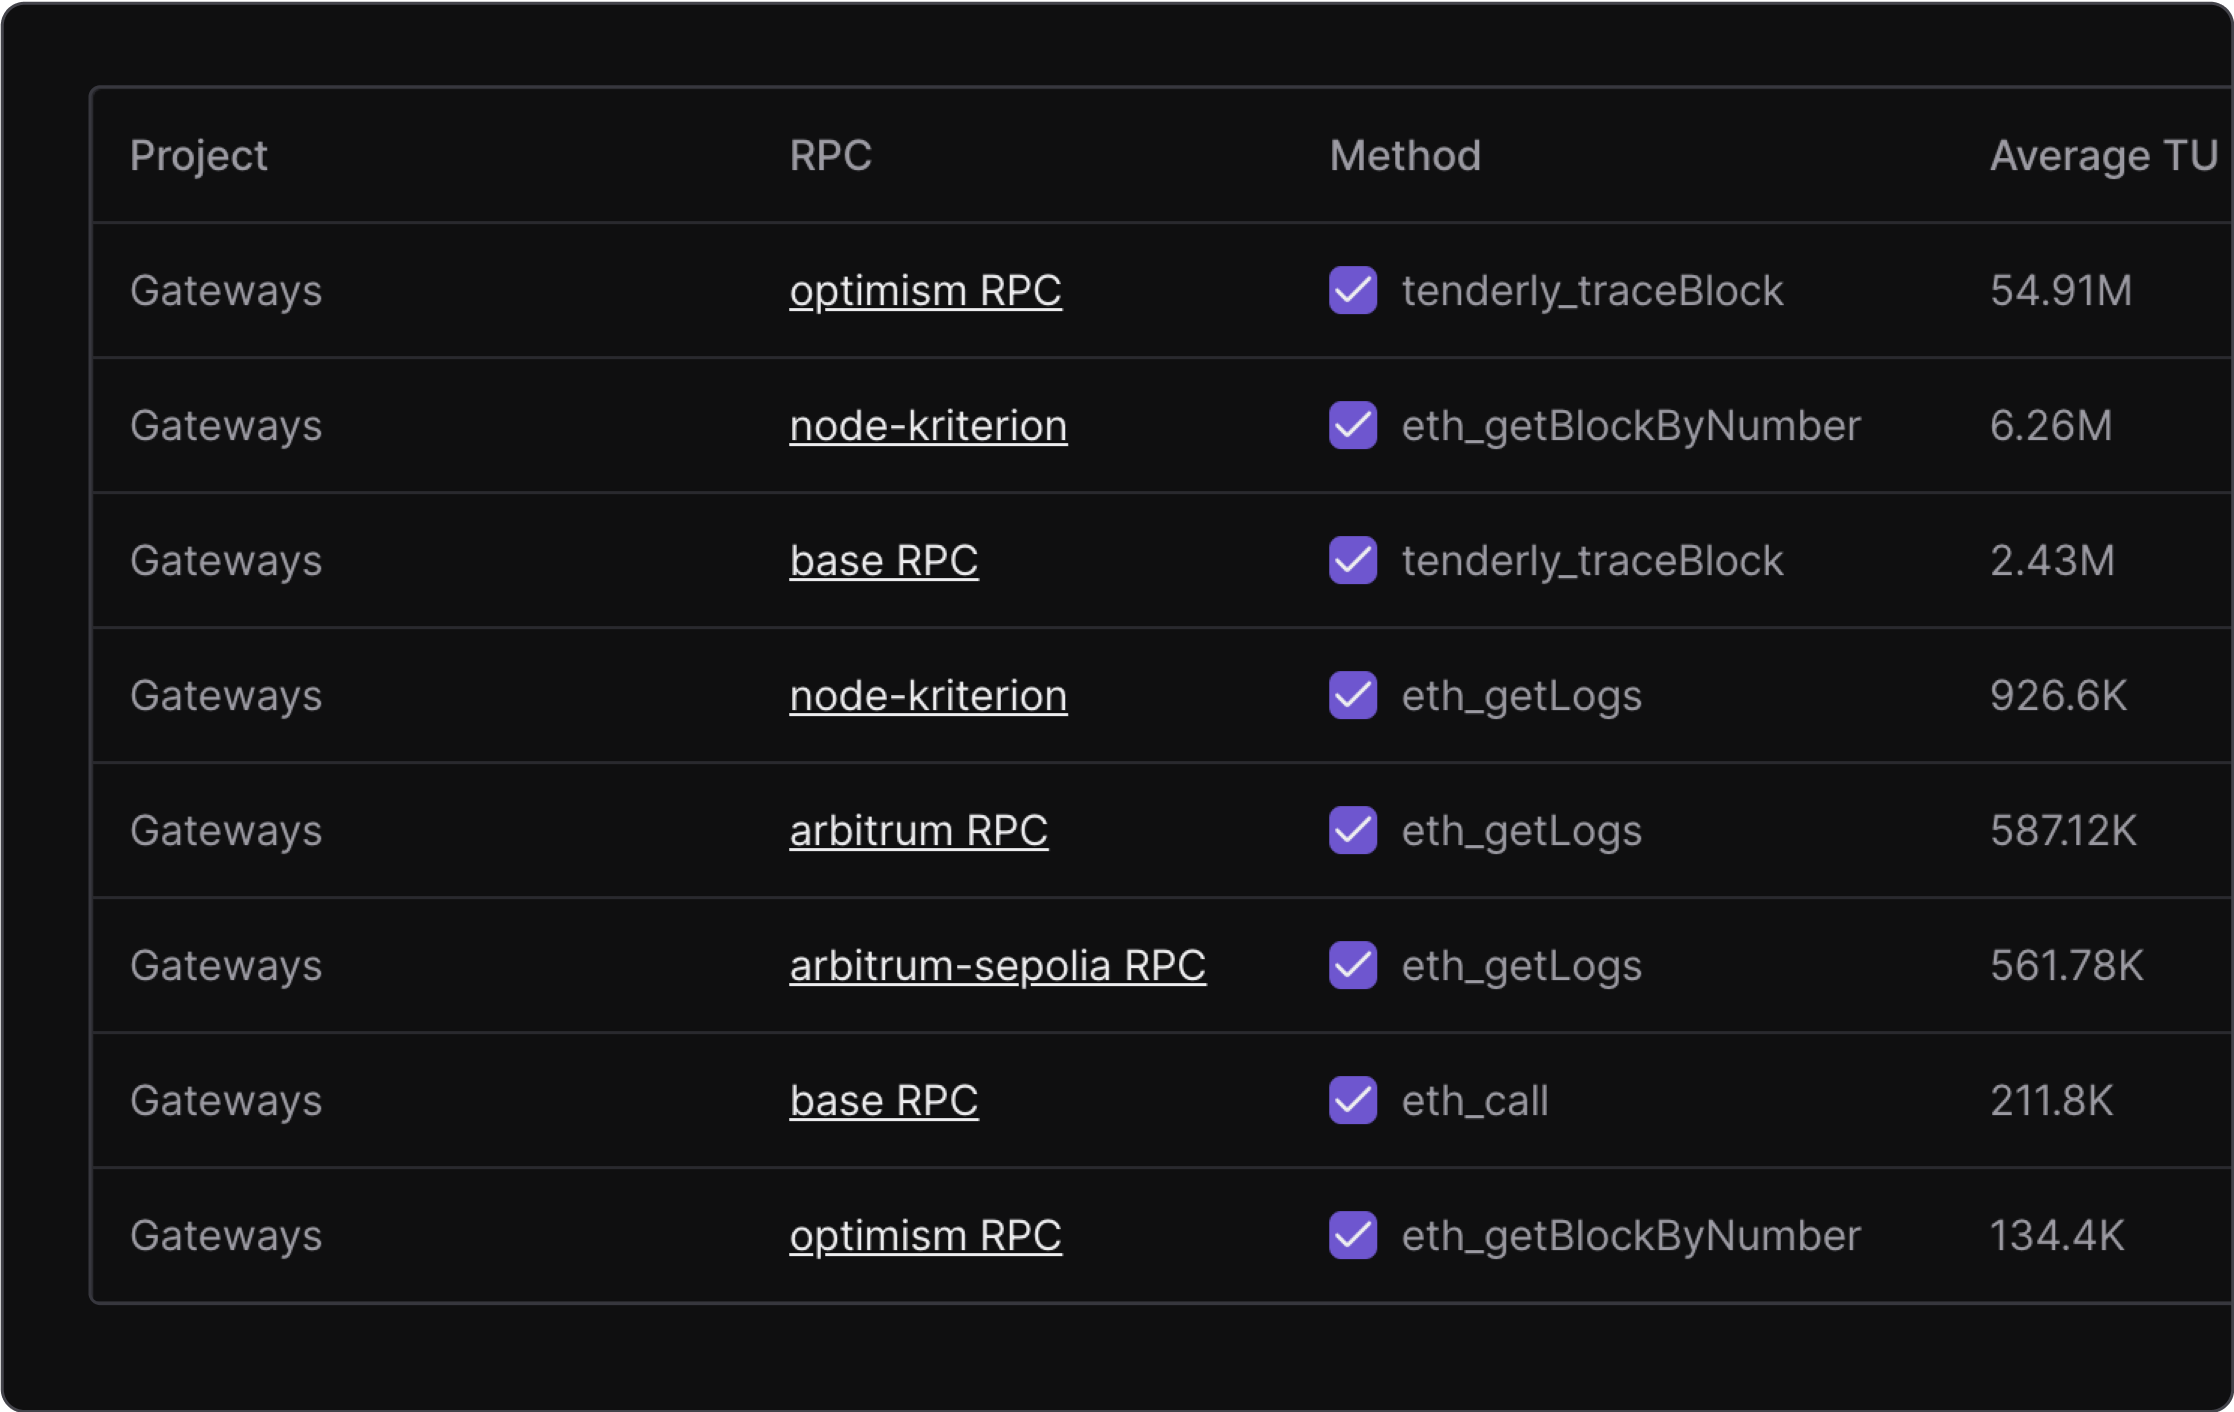
Once you group data, you can drill into specific data points. For instance, you can even see what endpoints use the most TUs.
Node RPC & Virtual TestNet Usage
You can also analyze TU usage on Node RPC and Virtual TestNet pages.
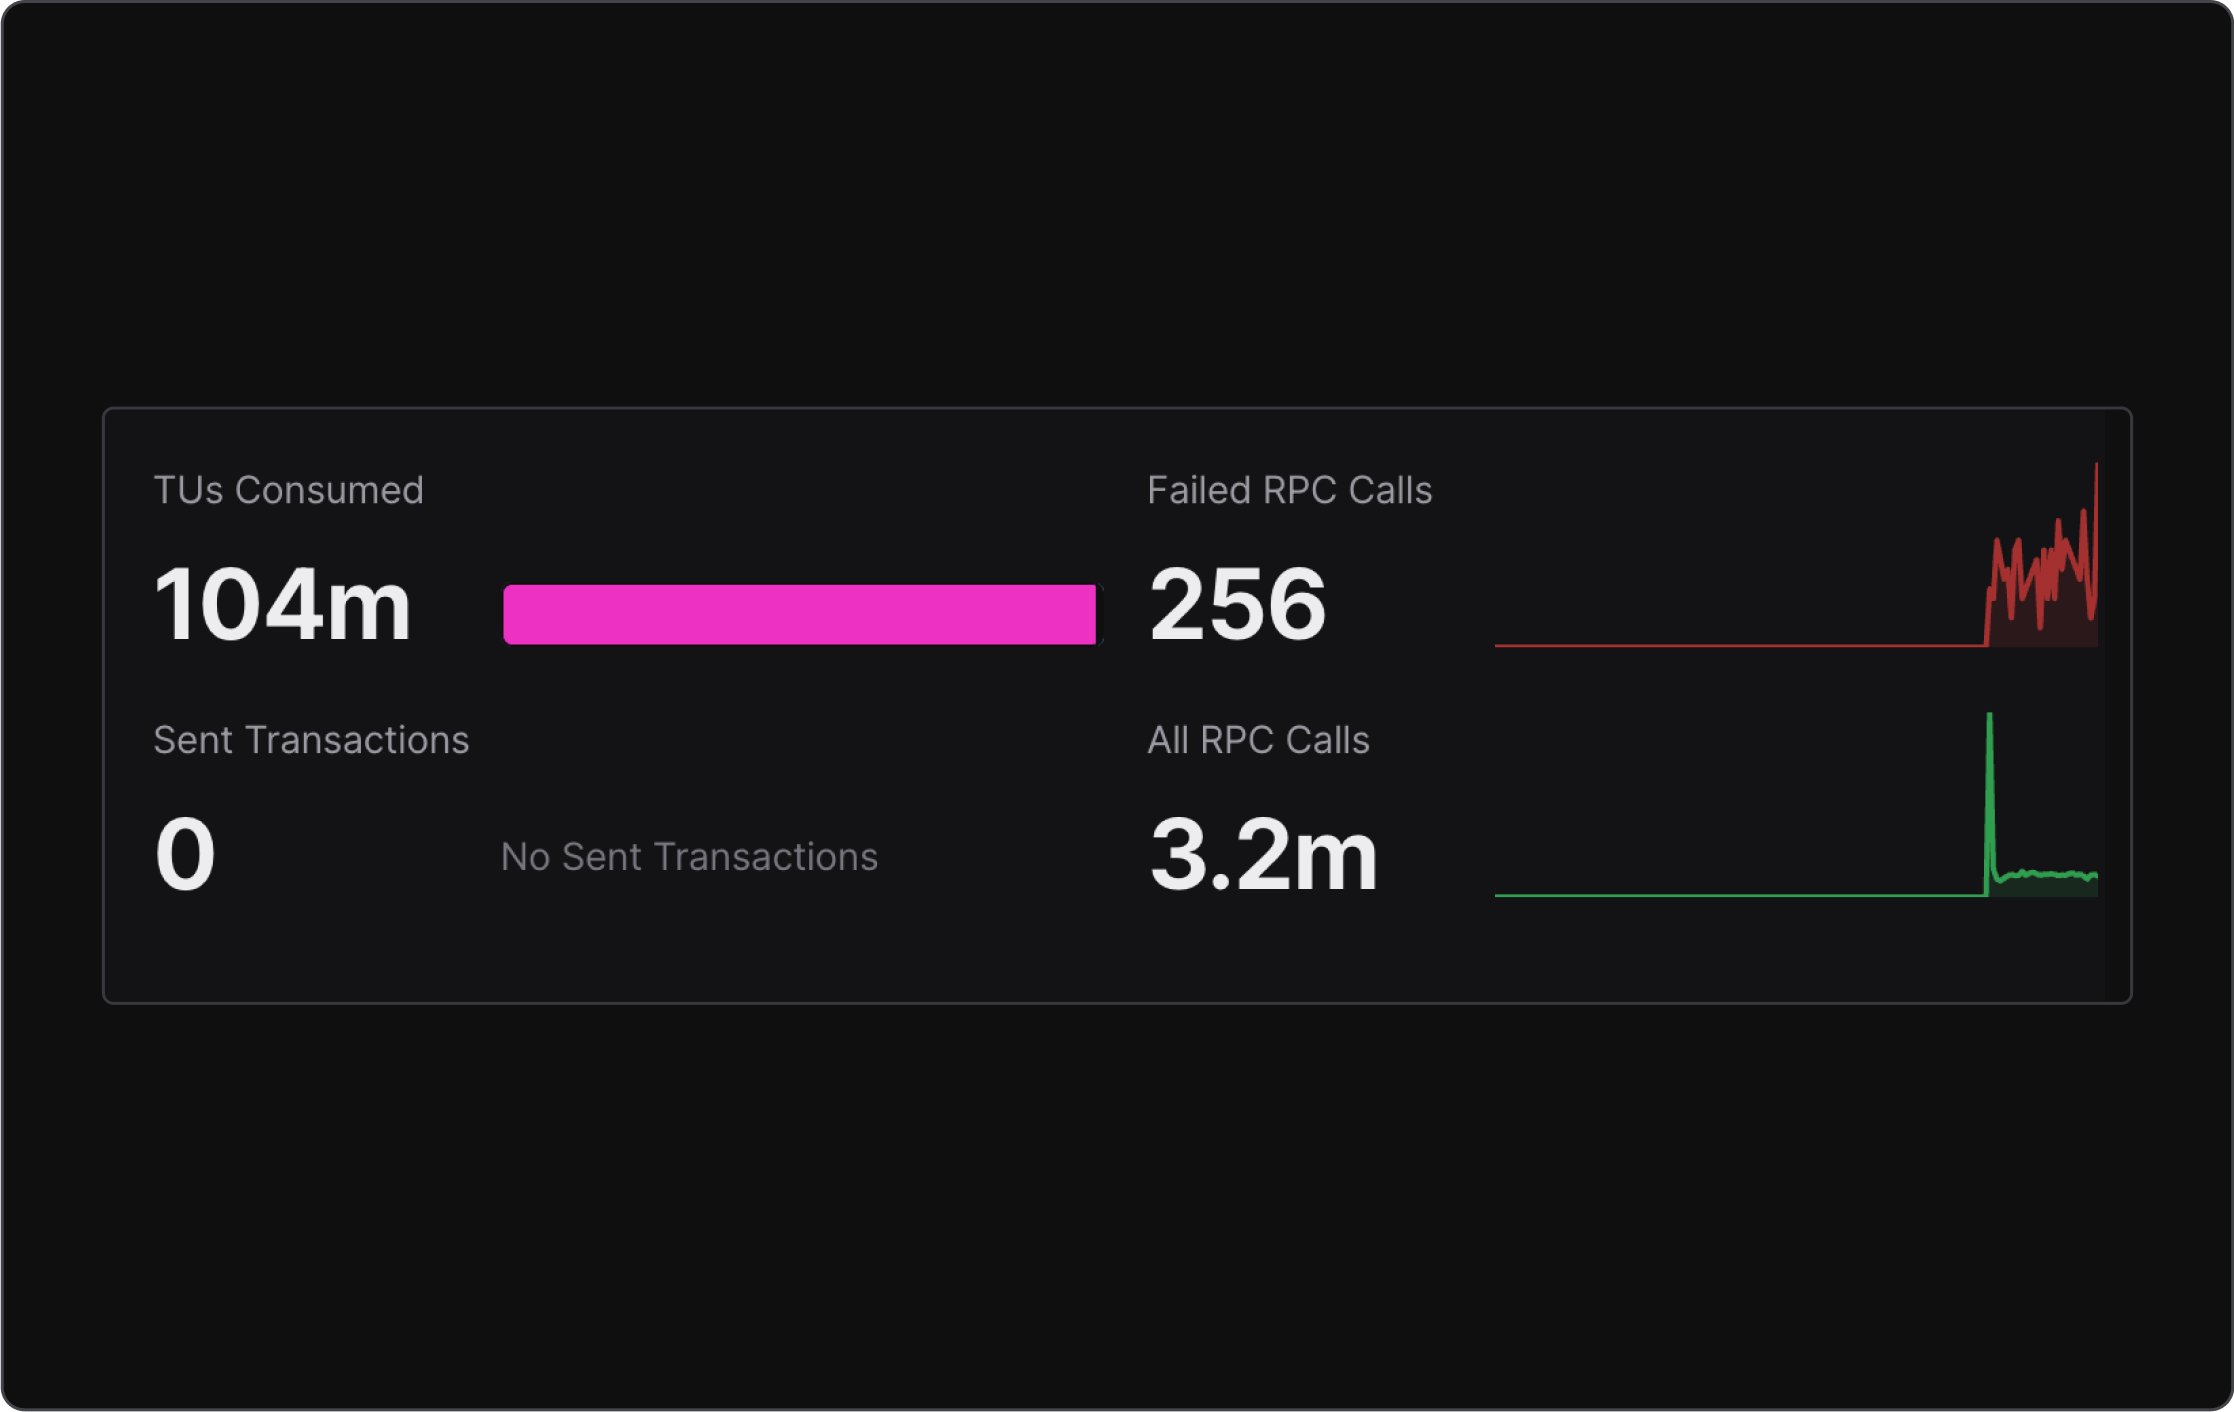
Once you open a Node or Virtual TestNet RPC, you get a short overview of usage for the selected RPC, including the number of consumed TUs, sent transactions, made RPC request calls, and failed requests.
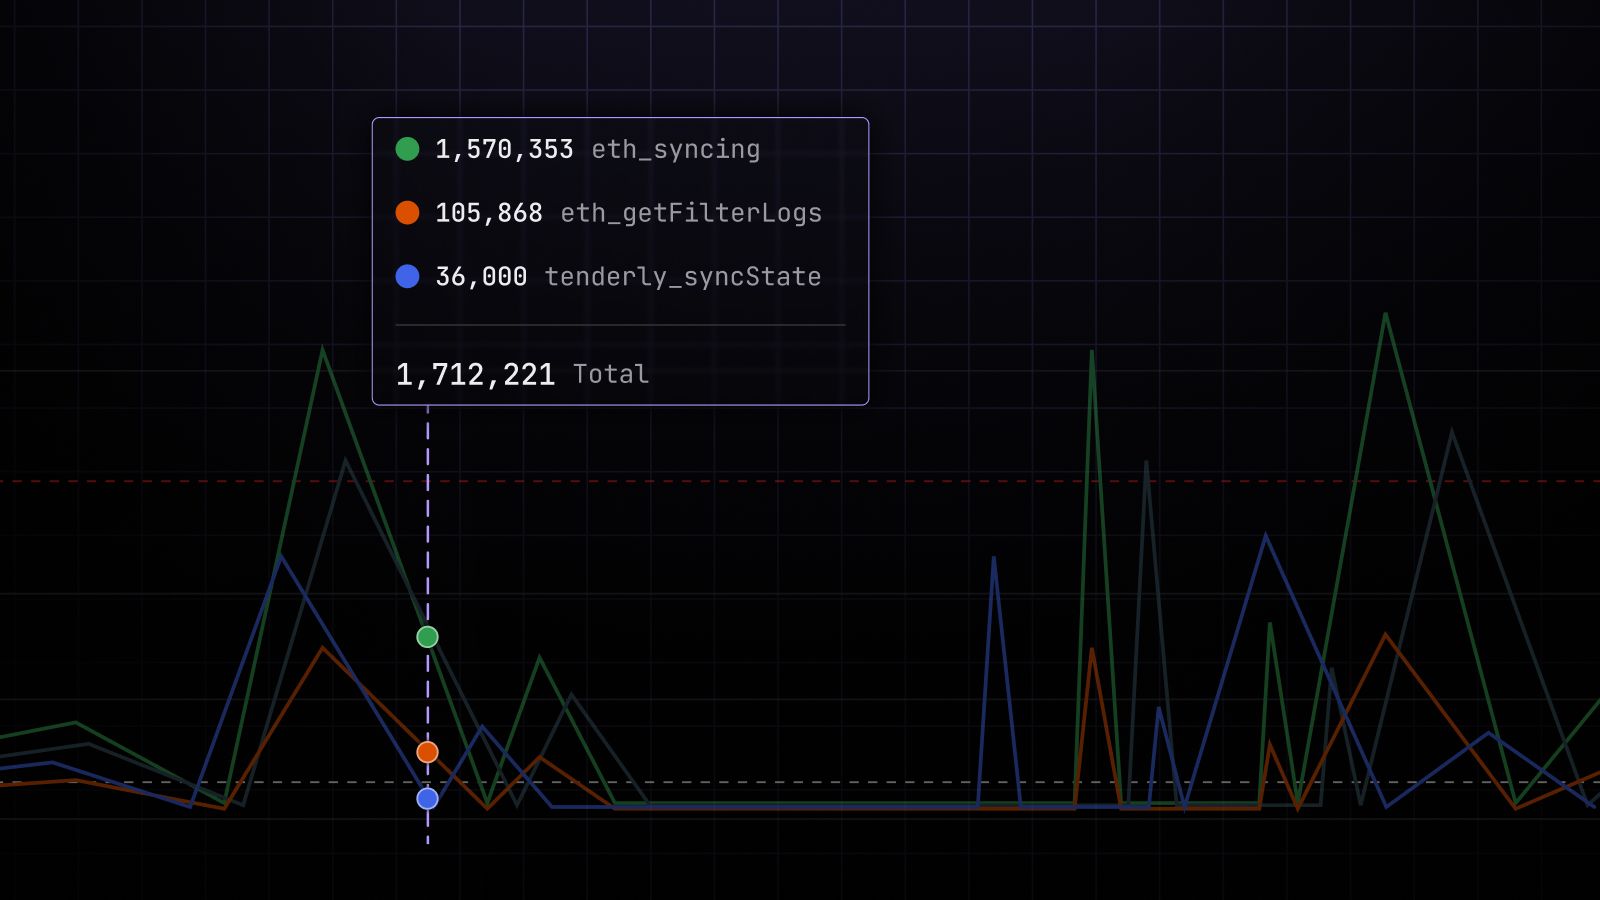
For a more in-depth overview of your RPC usage, you can analyze and filter requests across different categories such as method or status code.
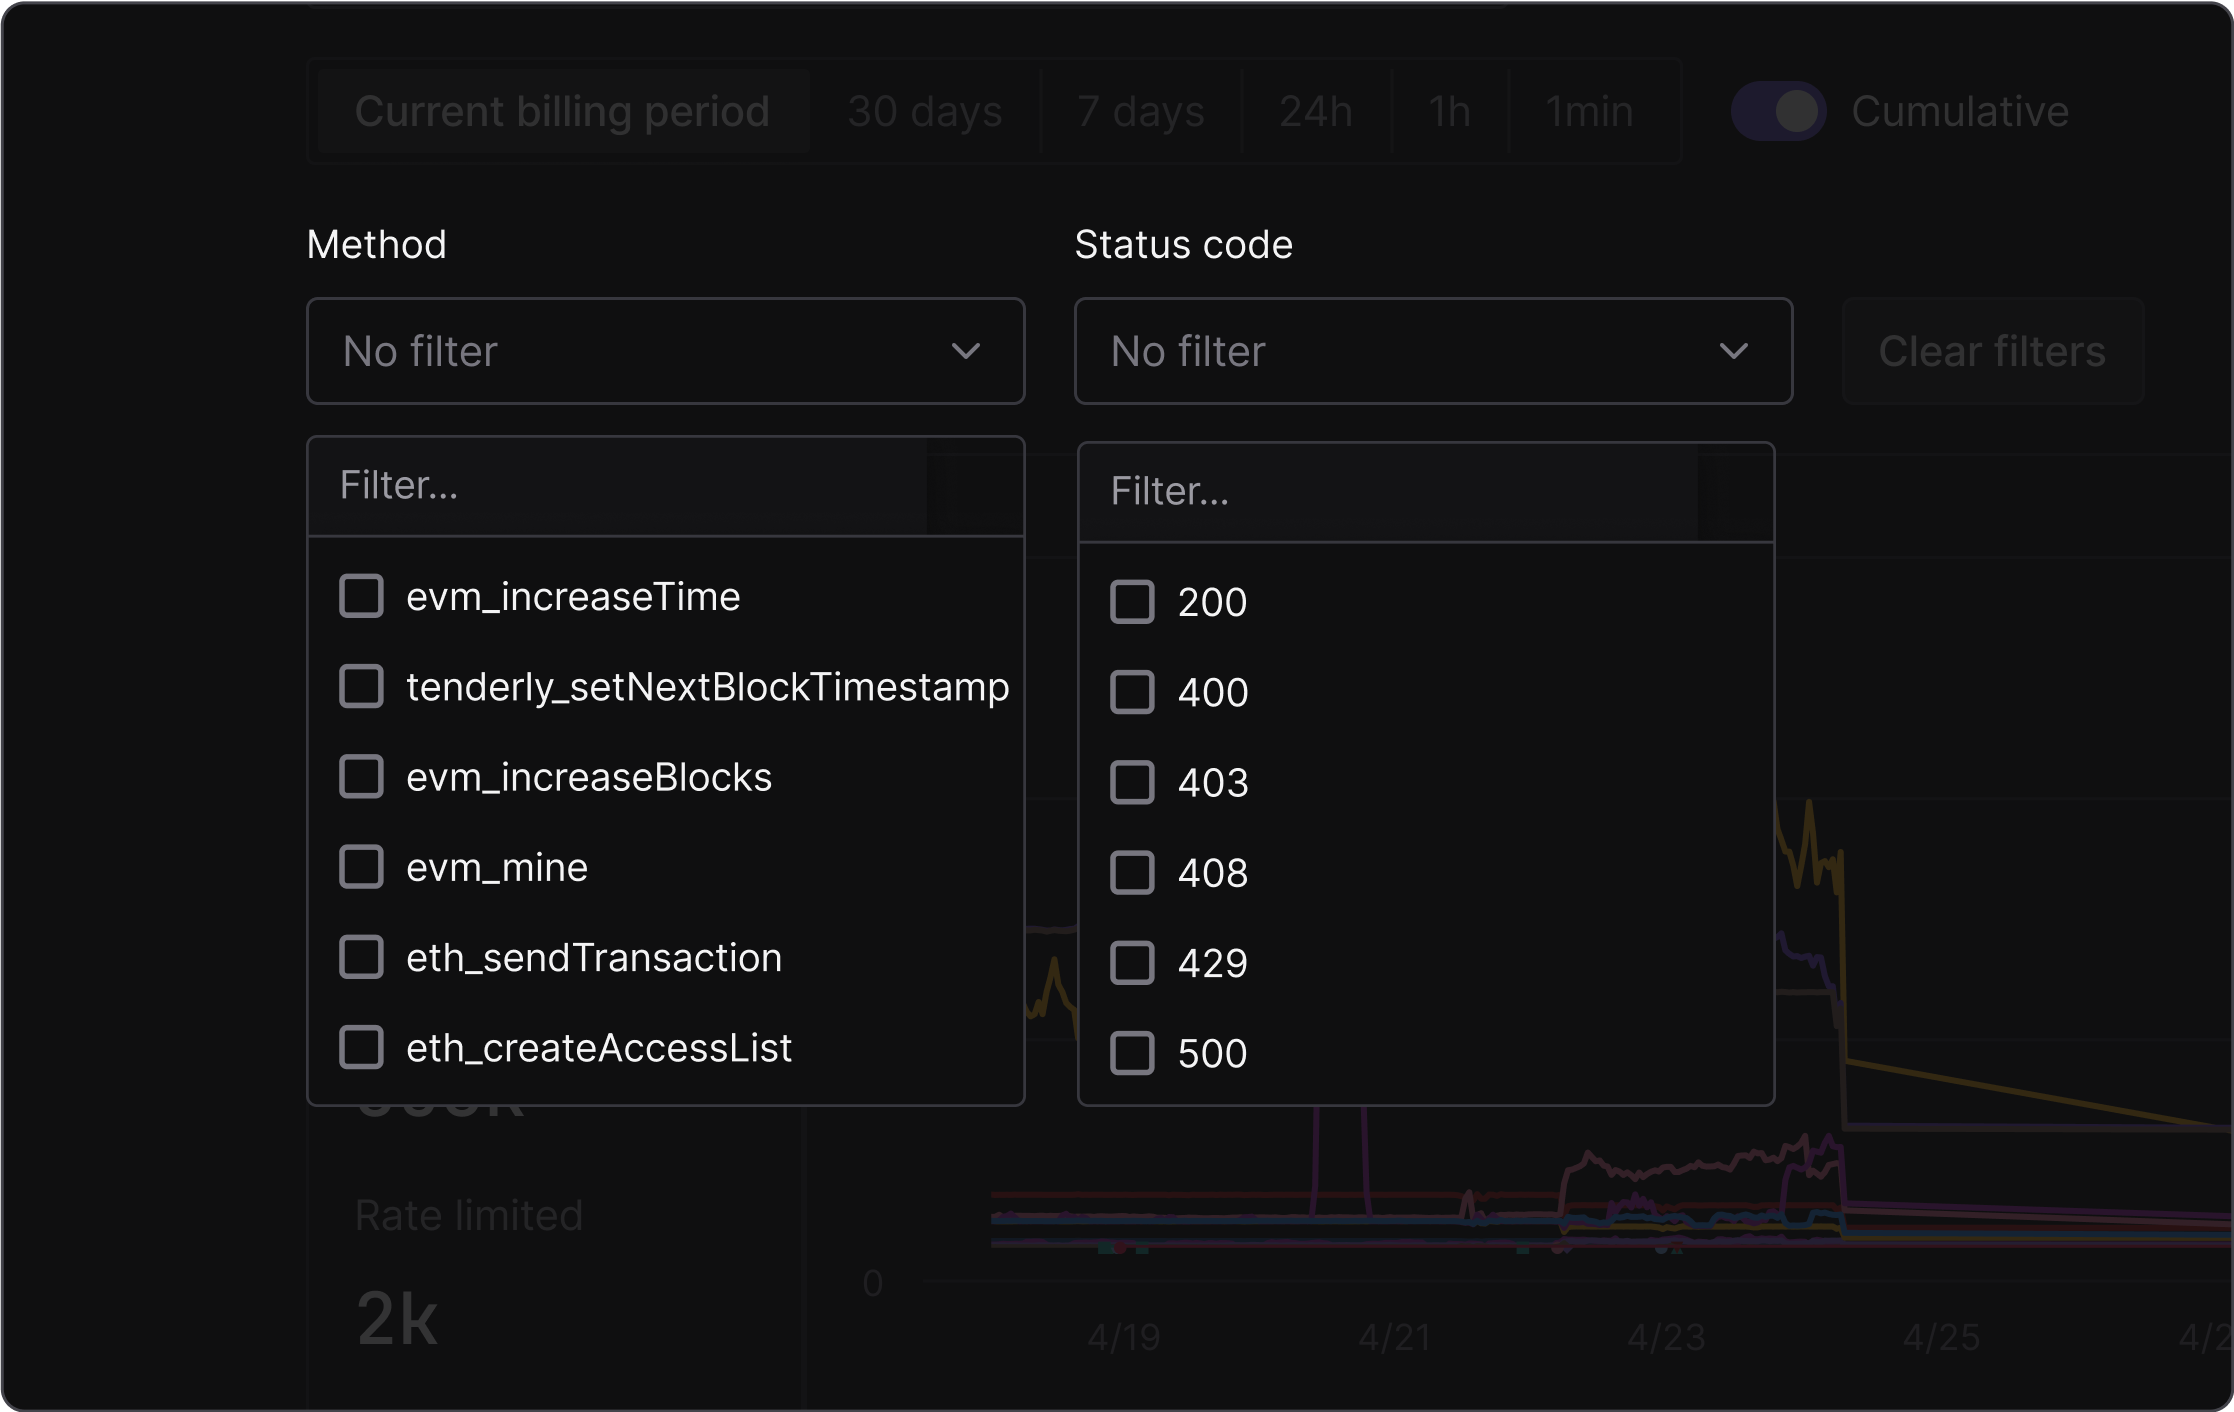
Here, you can also get insights into total TU usage and TU/s as on the Usage page.
Hard limits for Free & Starter plans
TU usage will now be hard-limited for Free and Starter plans once it exceeds the plans’ threshold. Soft and custom limits are available for Pro and Pro+ plans respectively, providing additional flexibility and scalability.