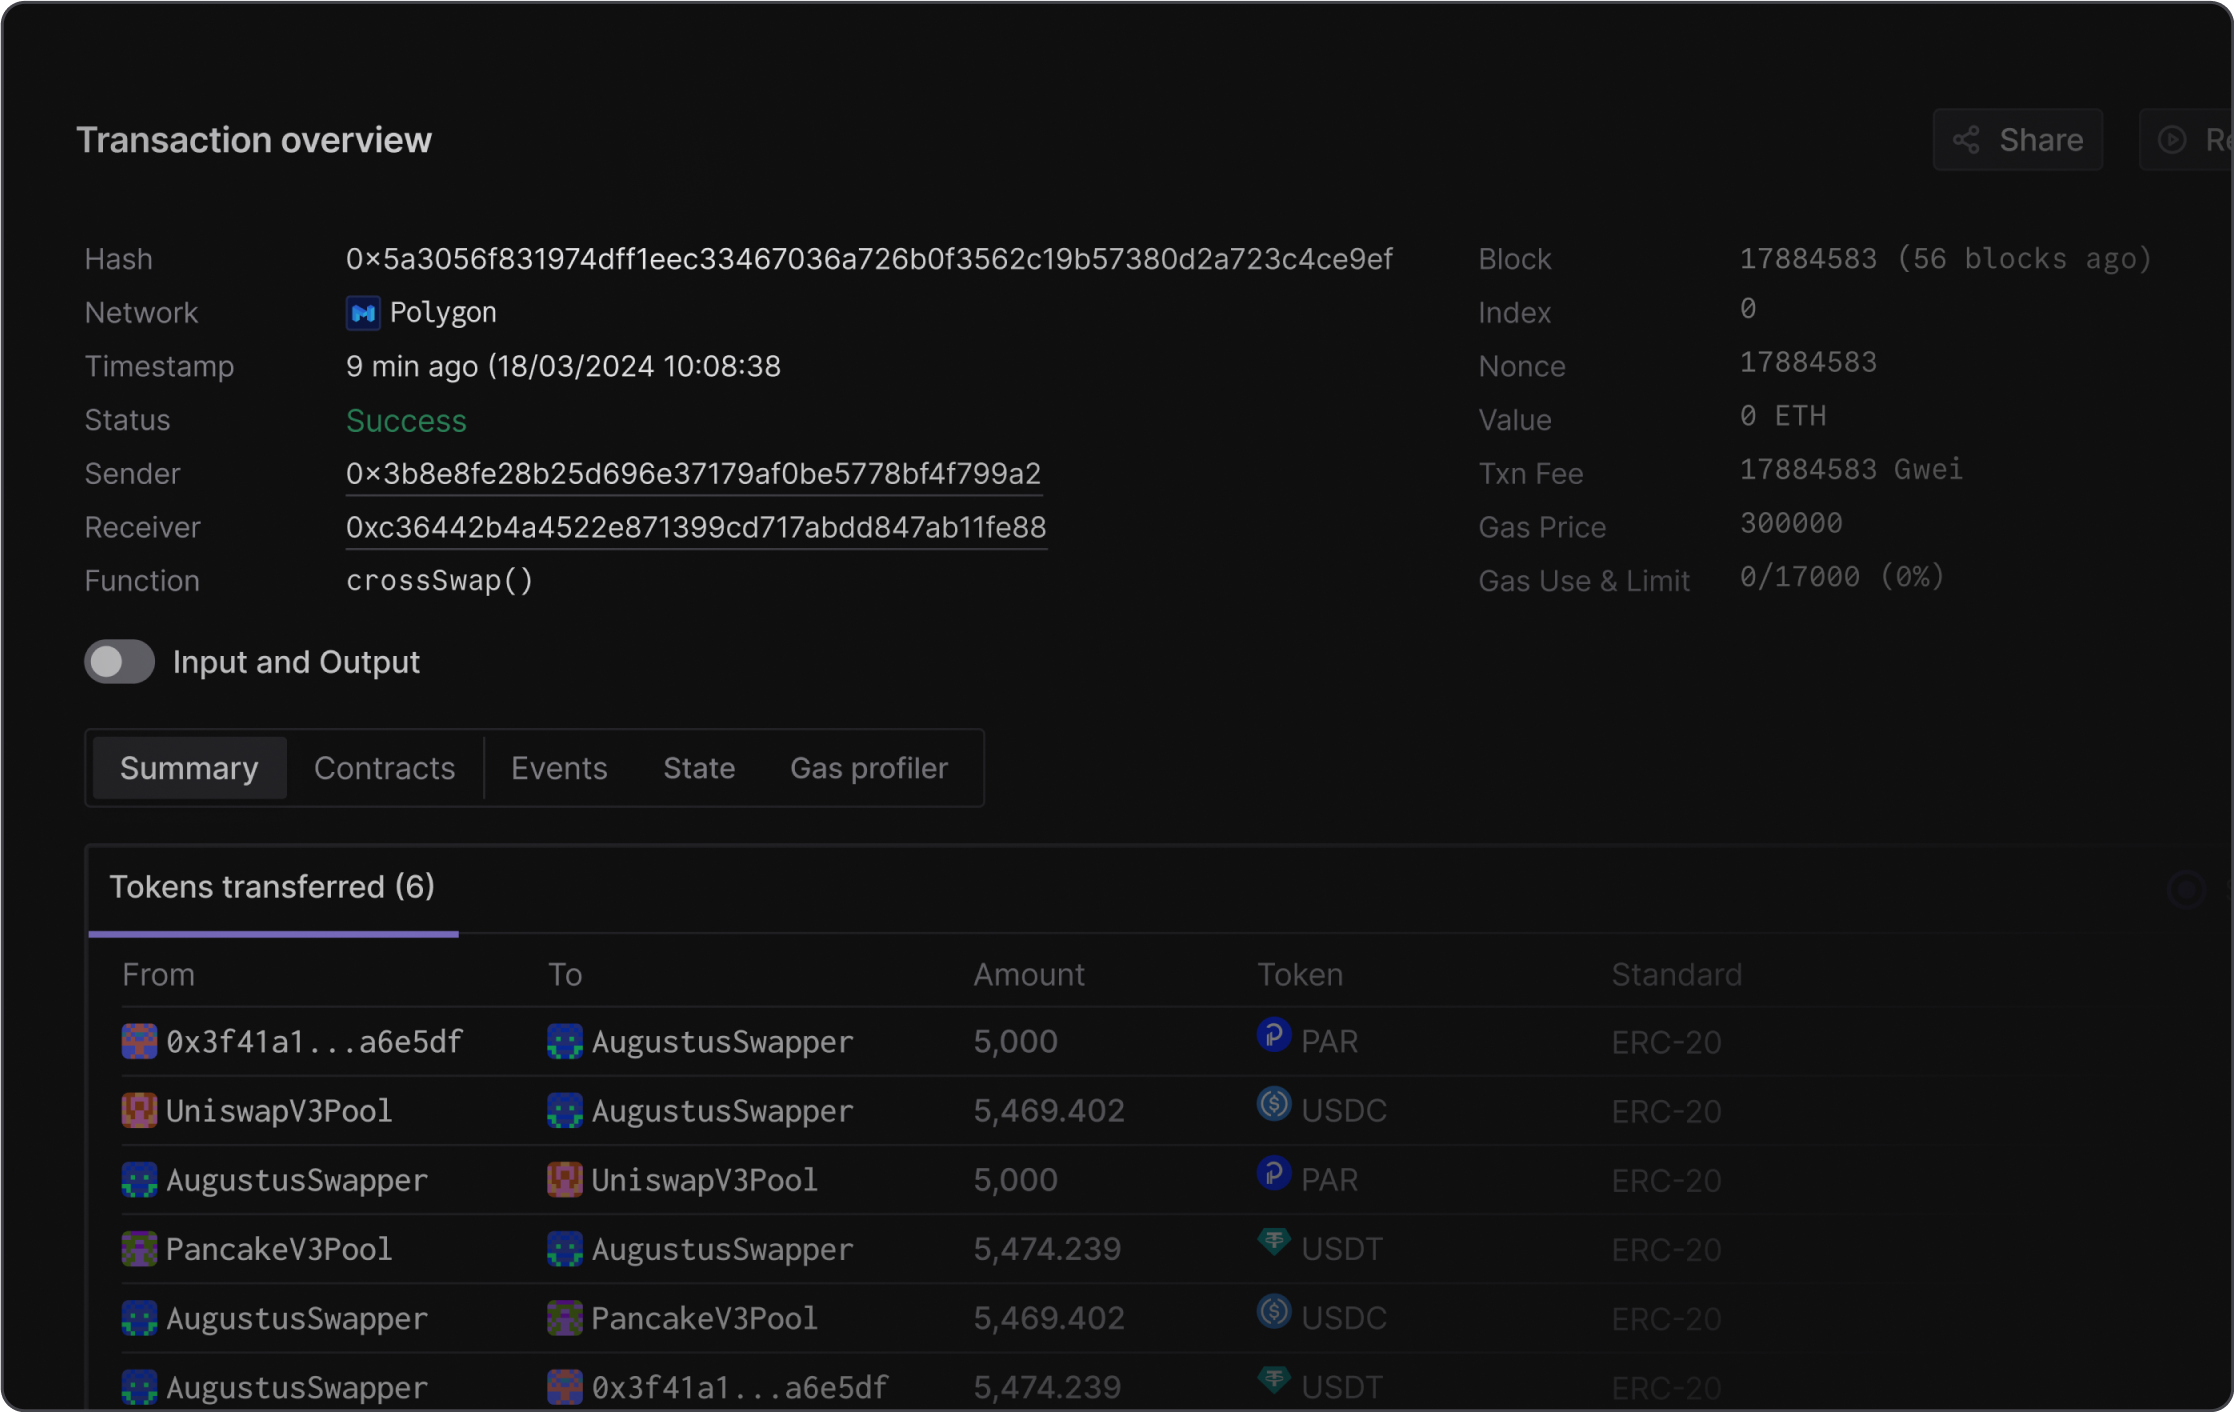
The Transaction Overview has been redesigned, bringing you new customization possibilities, greater data readability, and more efficient debugging.
Transaction loading times
Transaction loading times are now 2x faster, allowing you to expand all execution details instantly. Load the entire transaction execution faster, no matter how data-heavy a transaction is.
Address customization
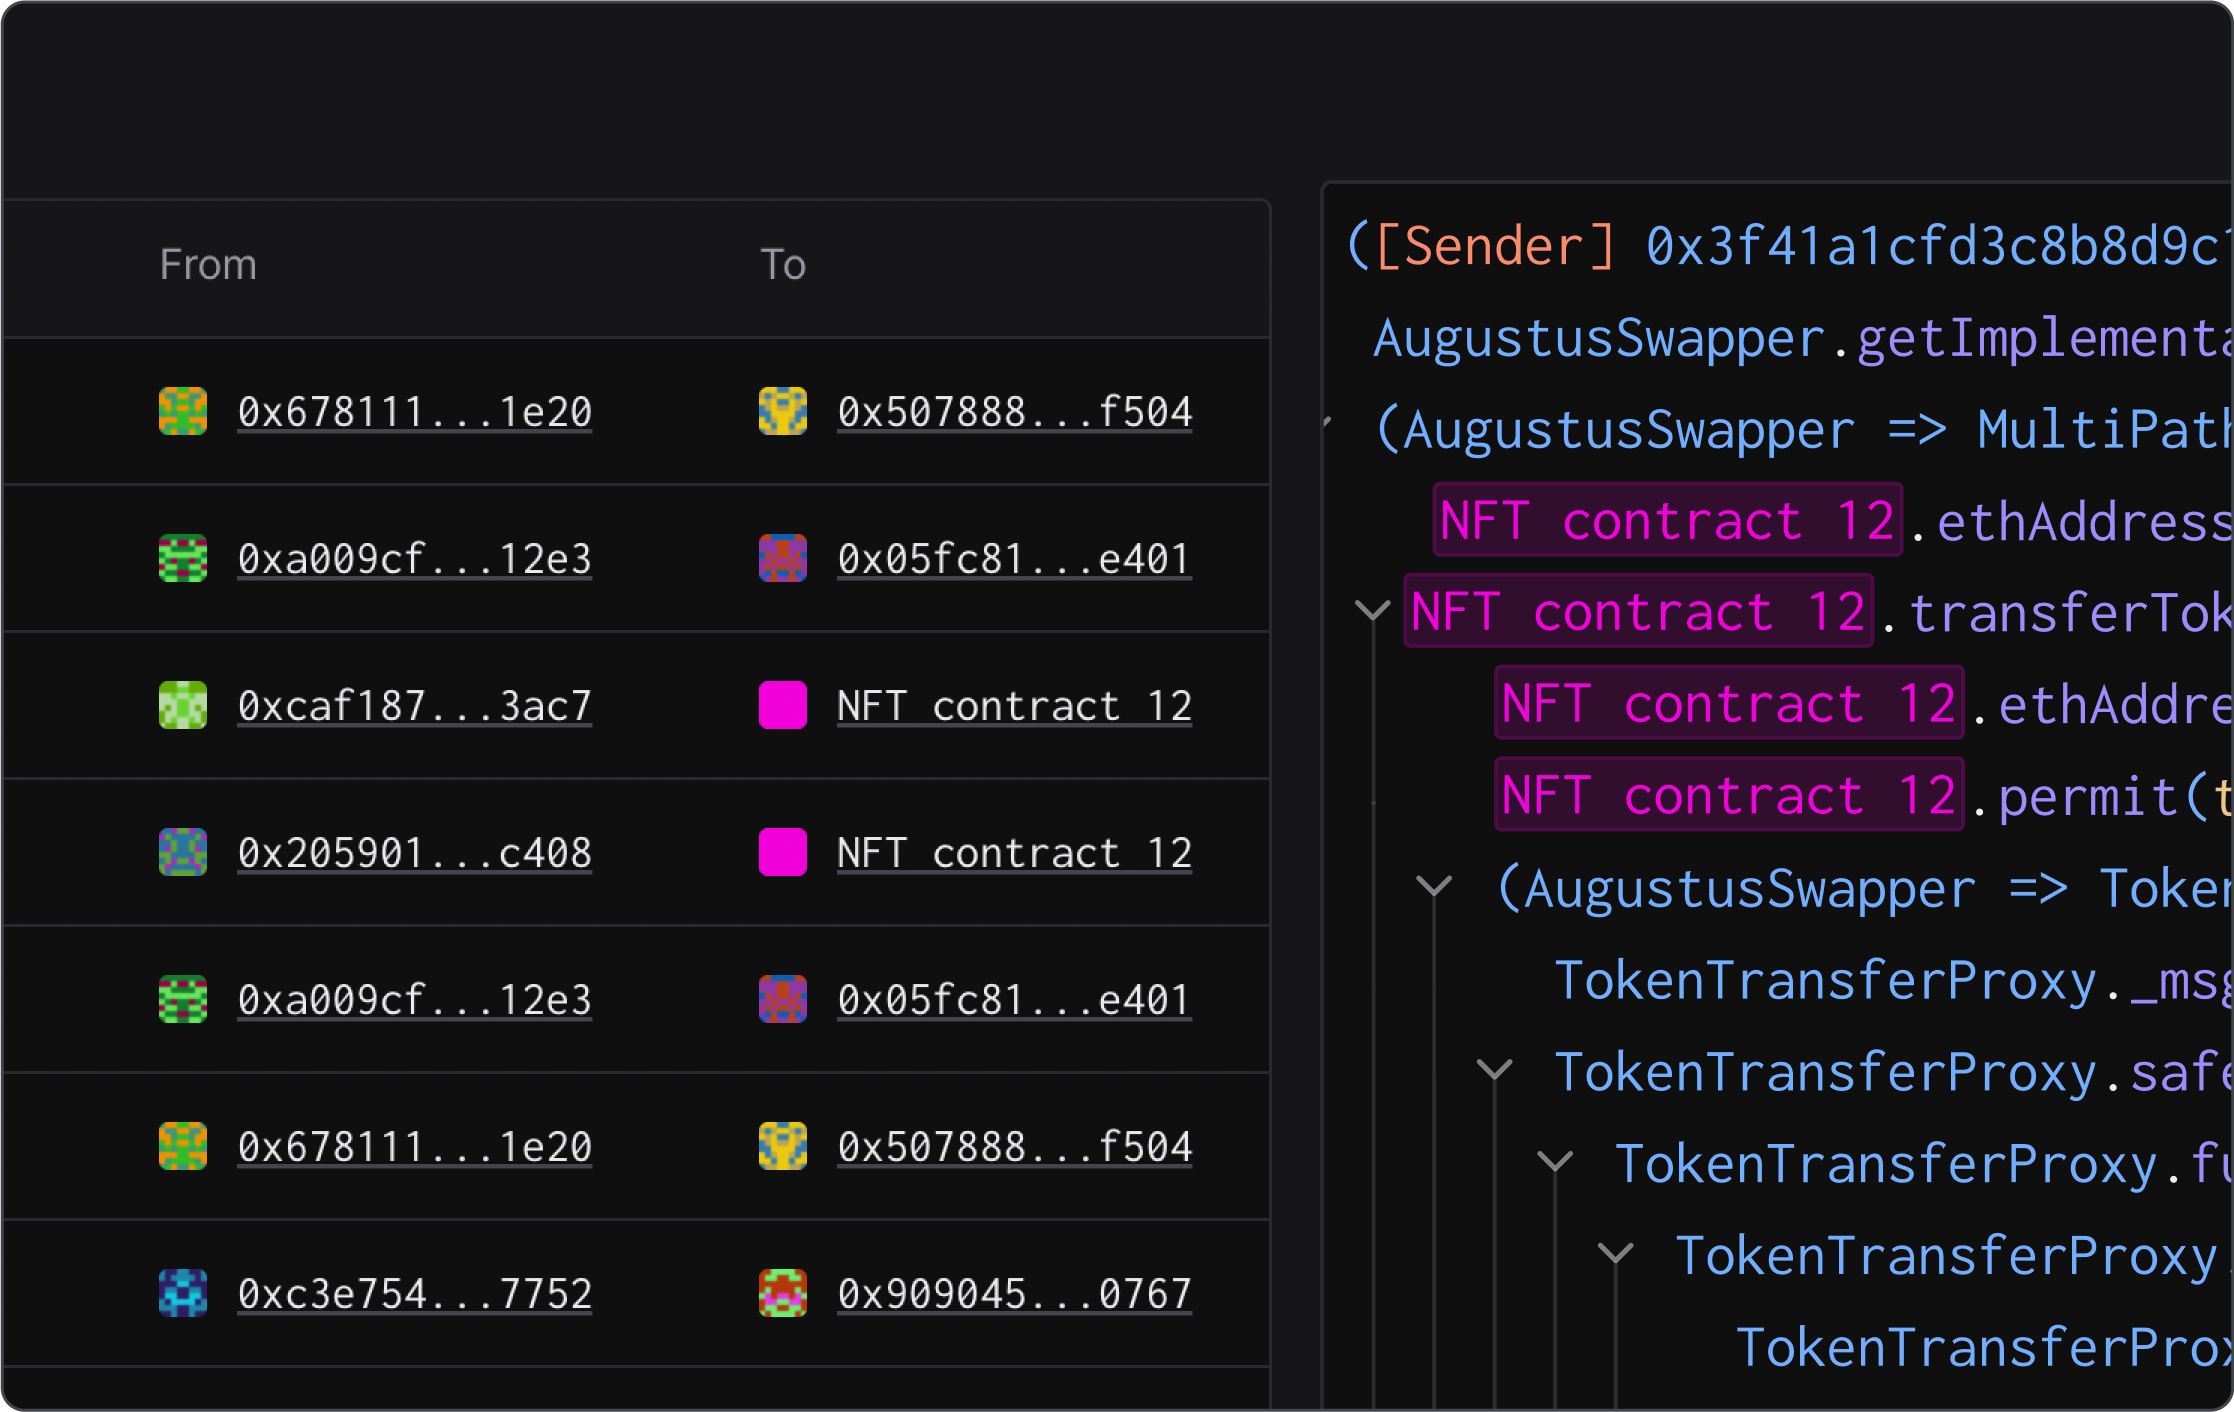
You can now highlight important addresses across your project through color-coding and custom naming. Set specific names and colors for team contracts for greater visibility across the Tenderly Dashboard.
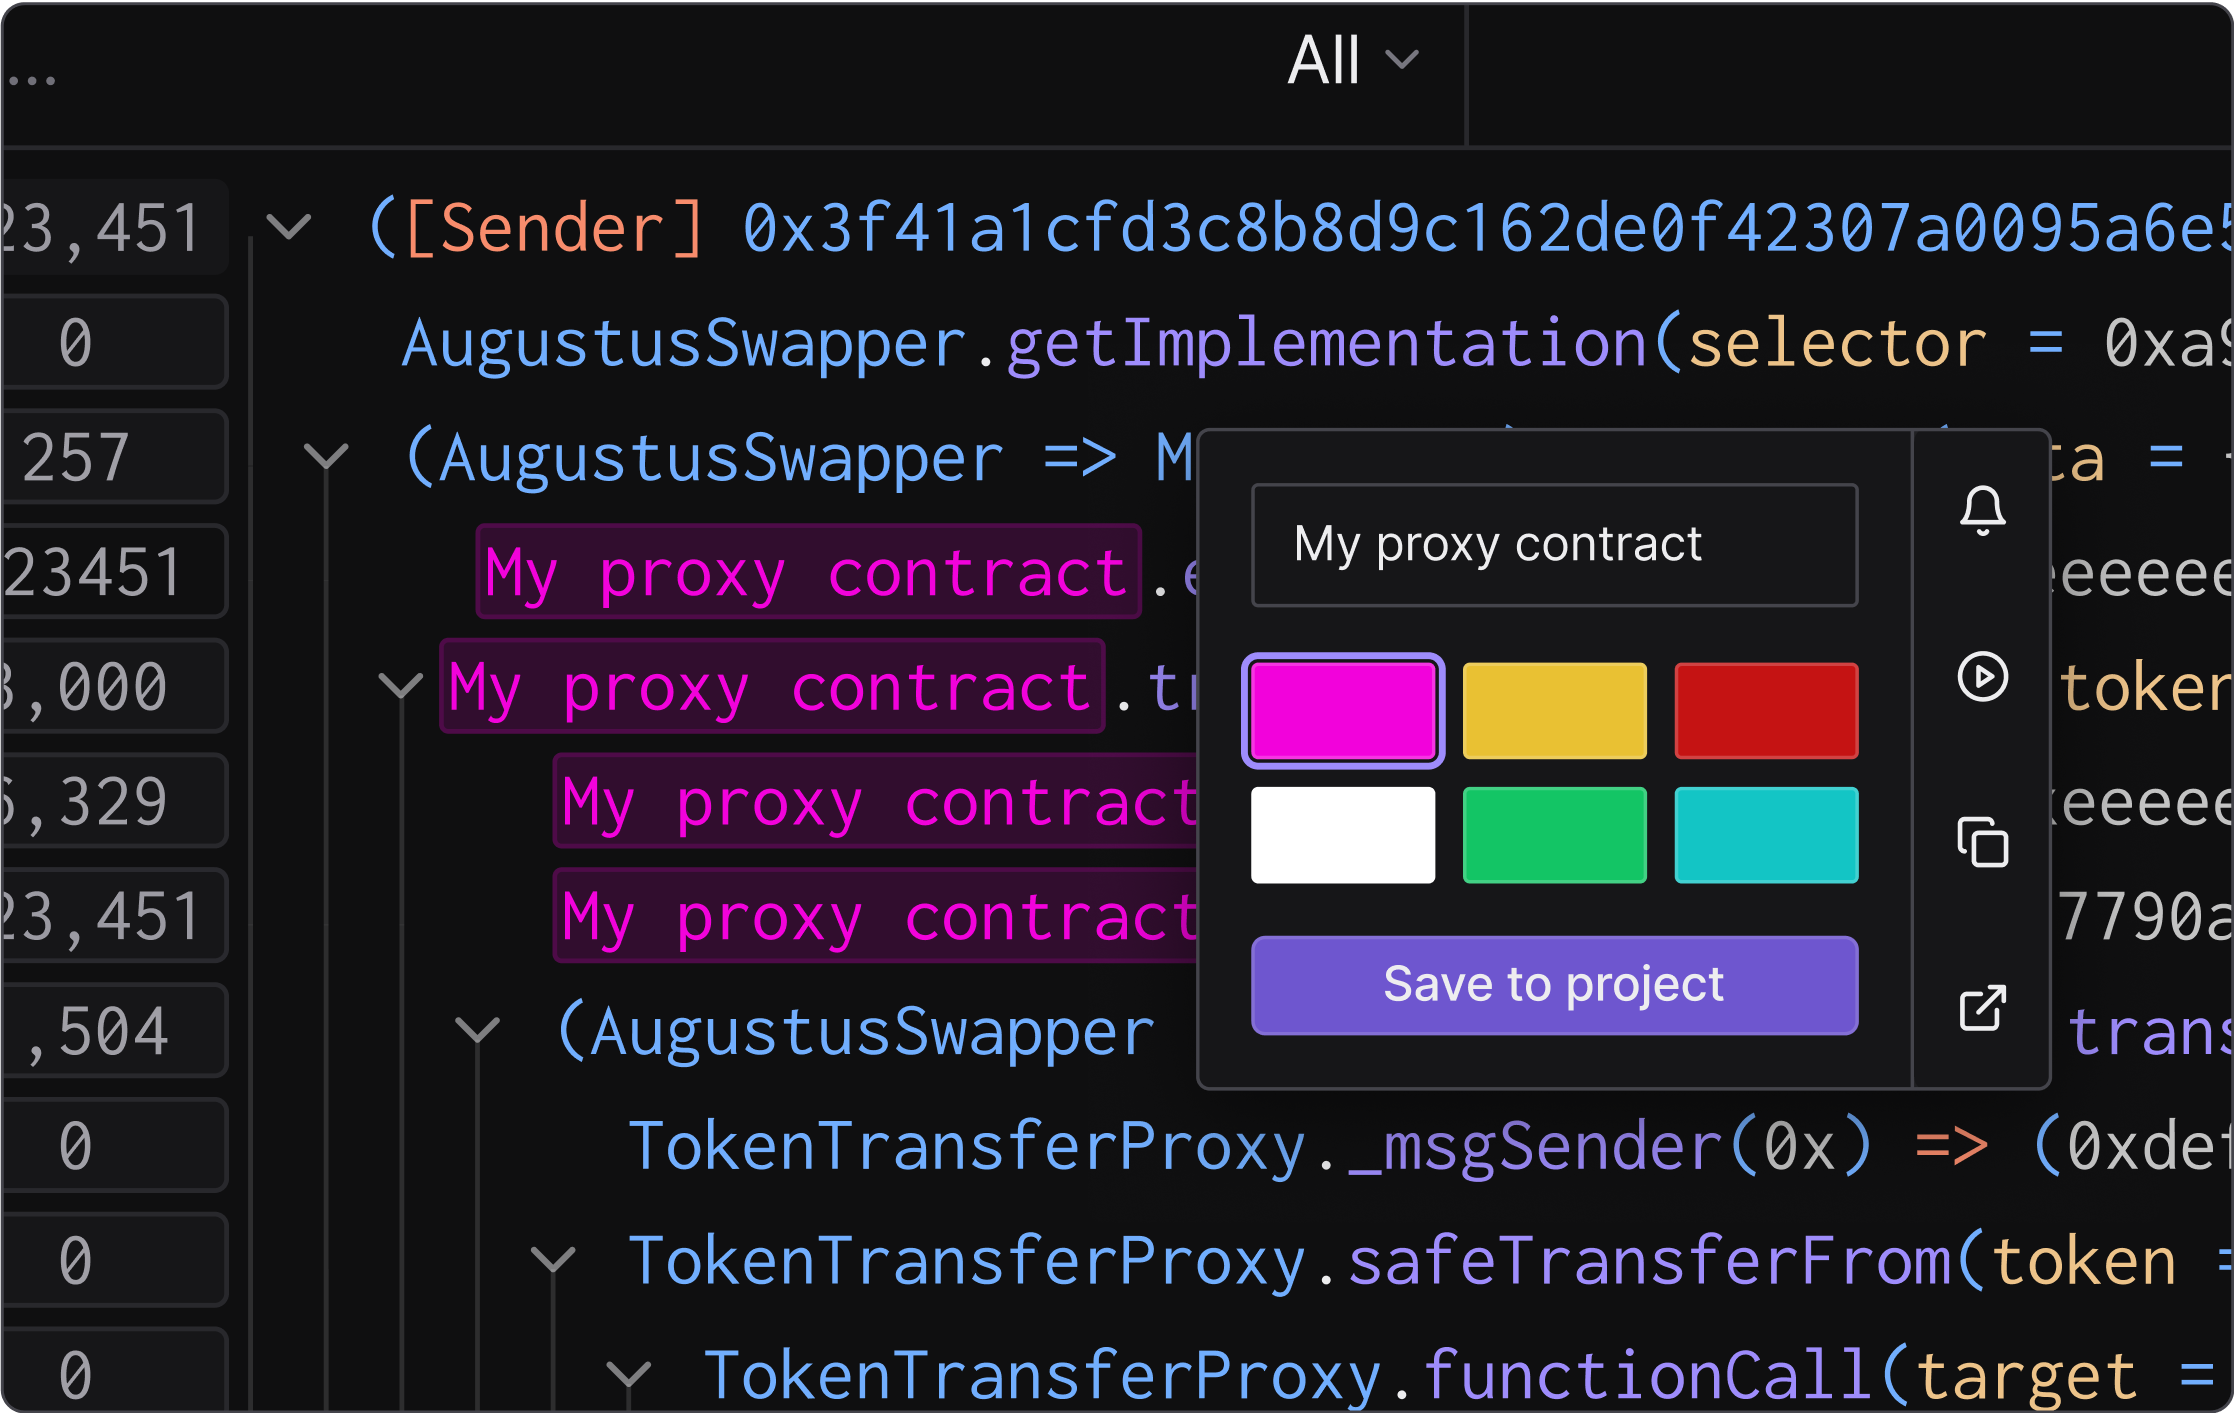
This way, you can mark all your treasury contracts so you don't have to hunt them down in a transaction. You can also label a potential hacker address to see if it's interacting with your contracts. Plus, your team can also navigate contract addresses more easily with labels clearly displayed in transaction listings too.
You can set custom names and colors directly from the transaction execution trace, as well as when adding contracts to Tenderly.
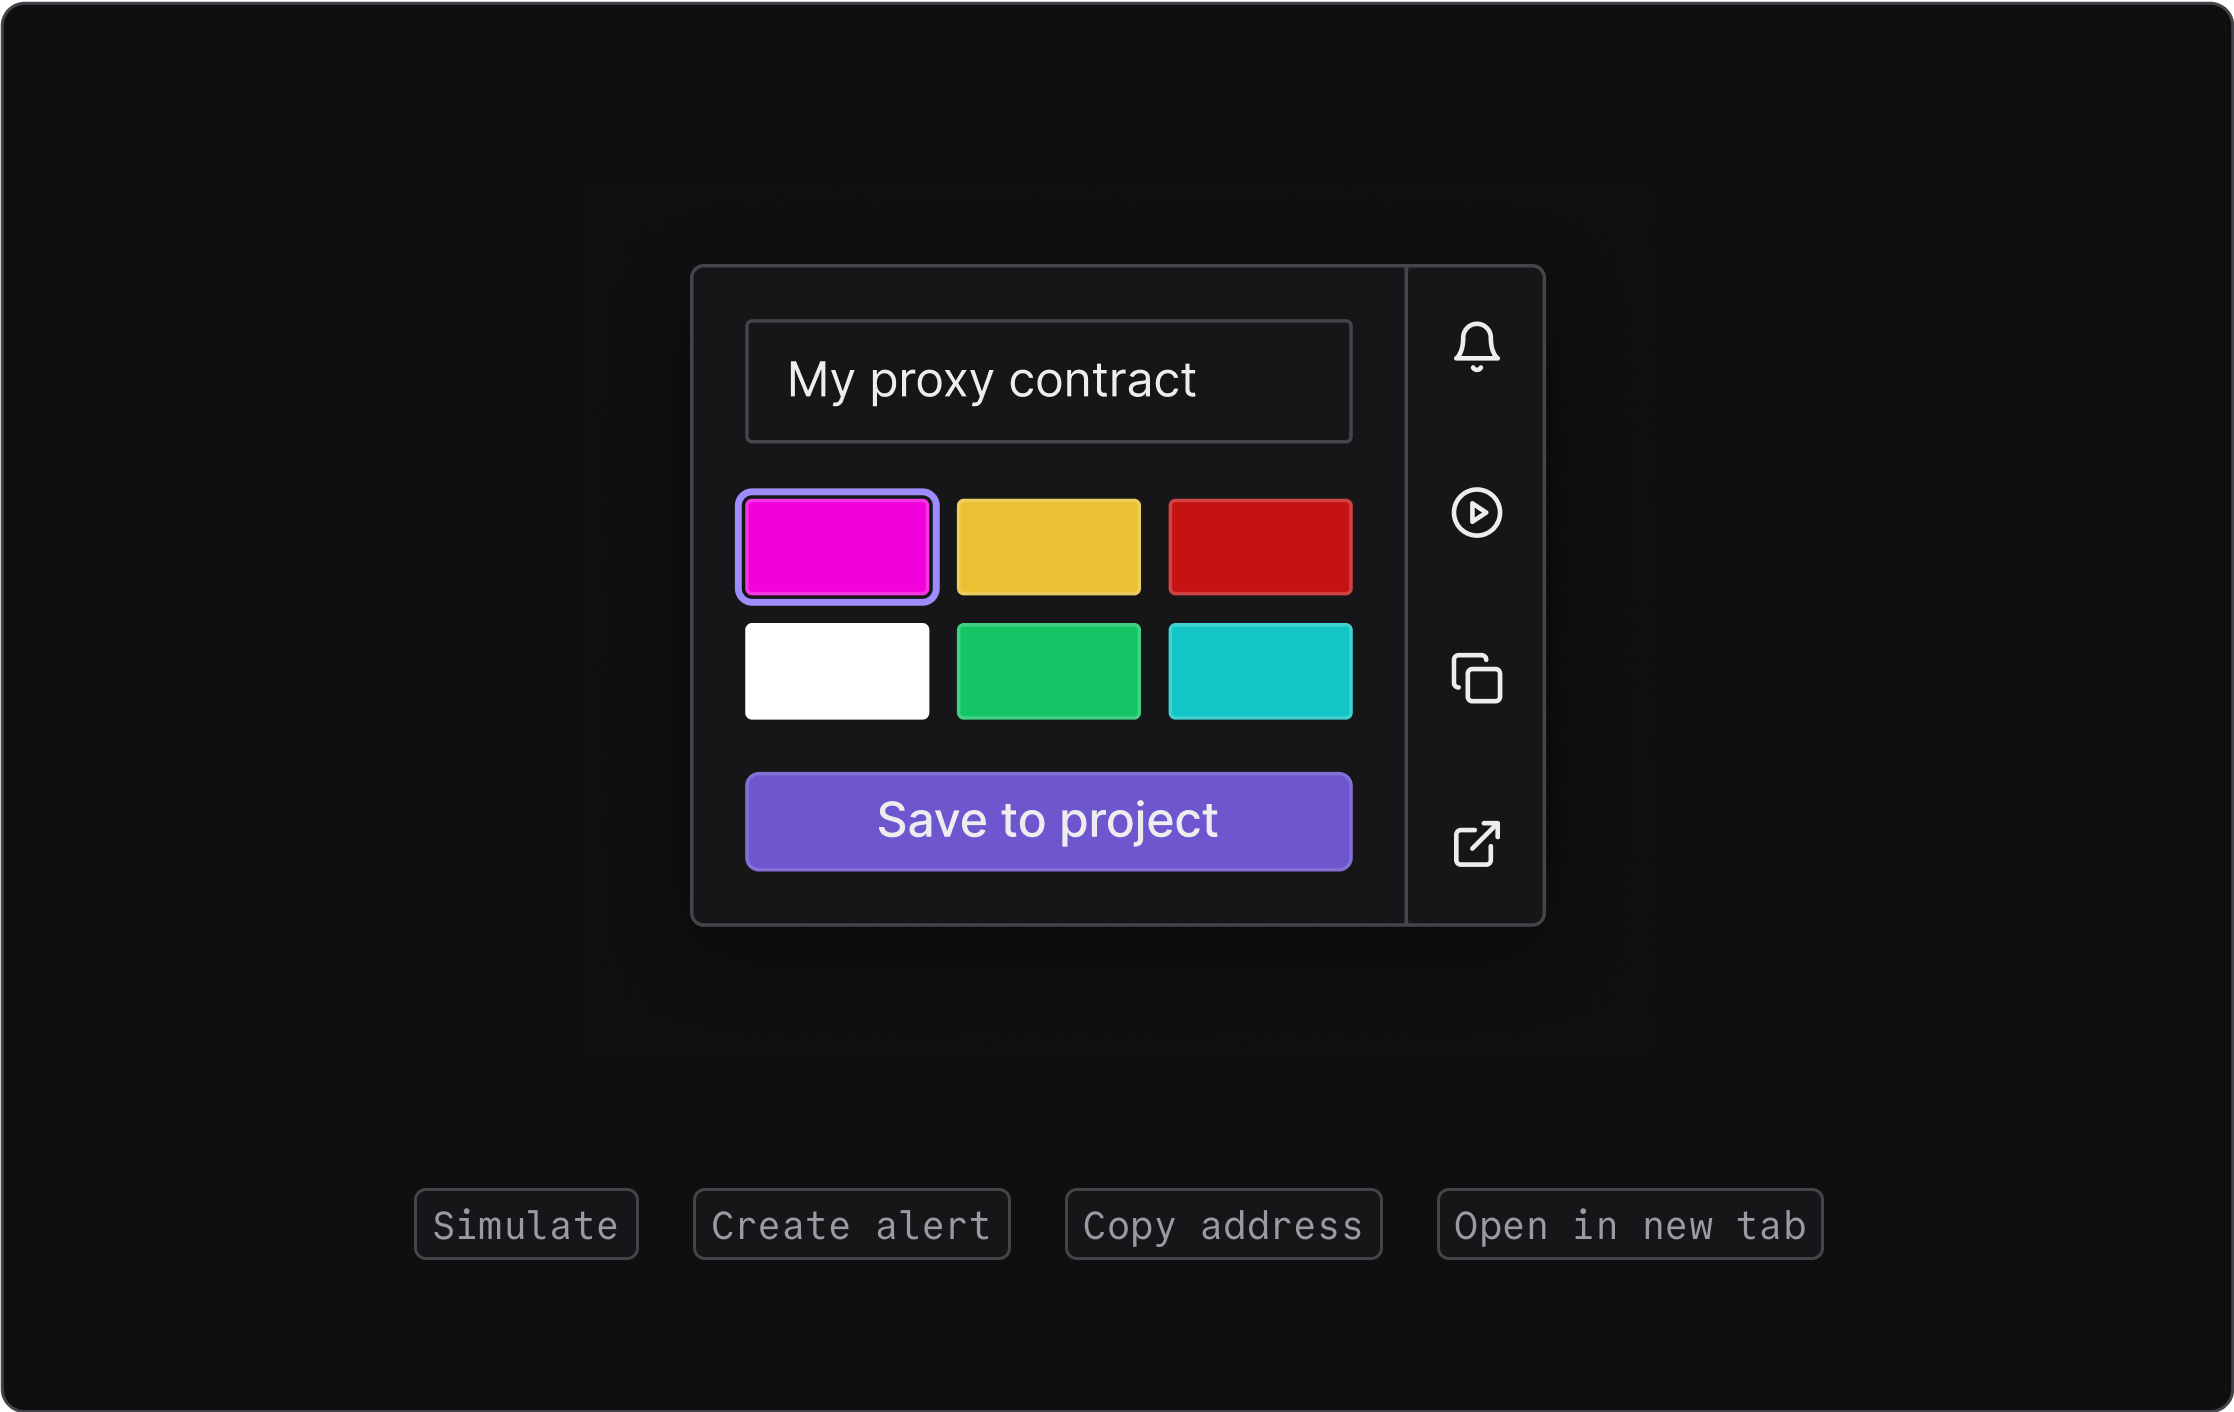
Contextual actions on any address
You can also take quick action on any address to set up an alert, run a simulation, or dive into further analysis. Explore and interact with any address directly from the transaction execution trace, without switching context. The addresses are now clickable too, enabling you to quickly open the execution trace.
Improved error discoverability
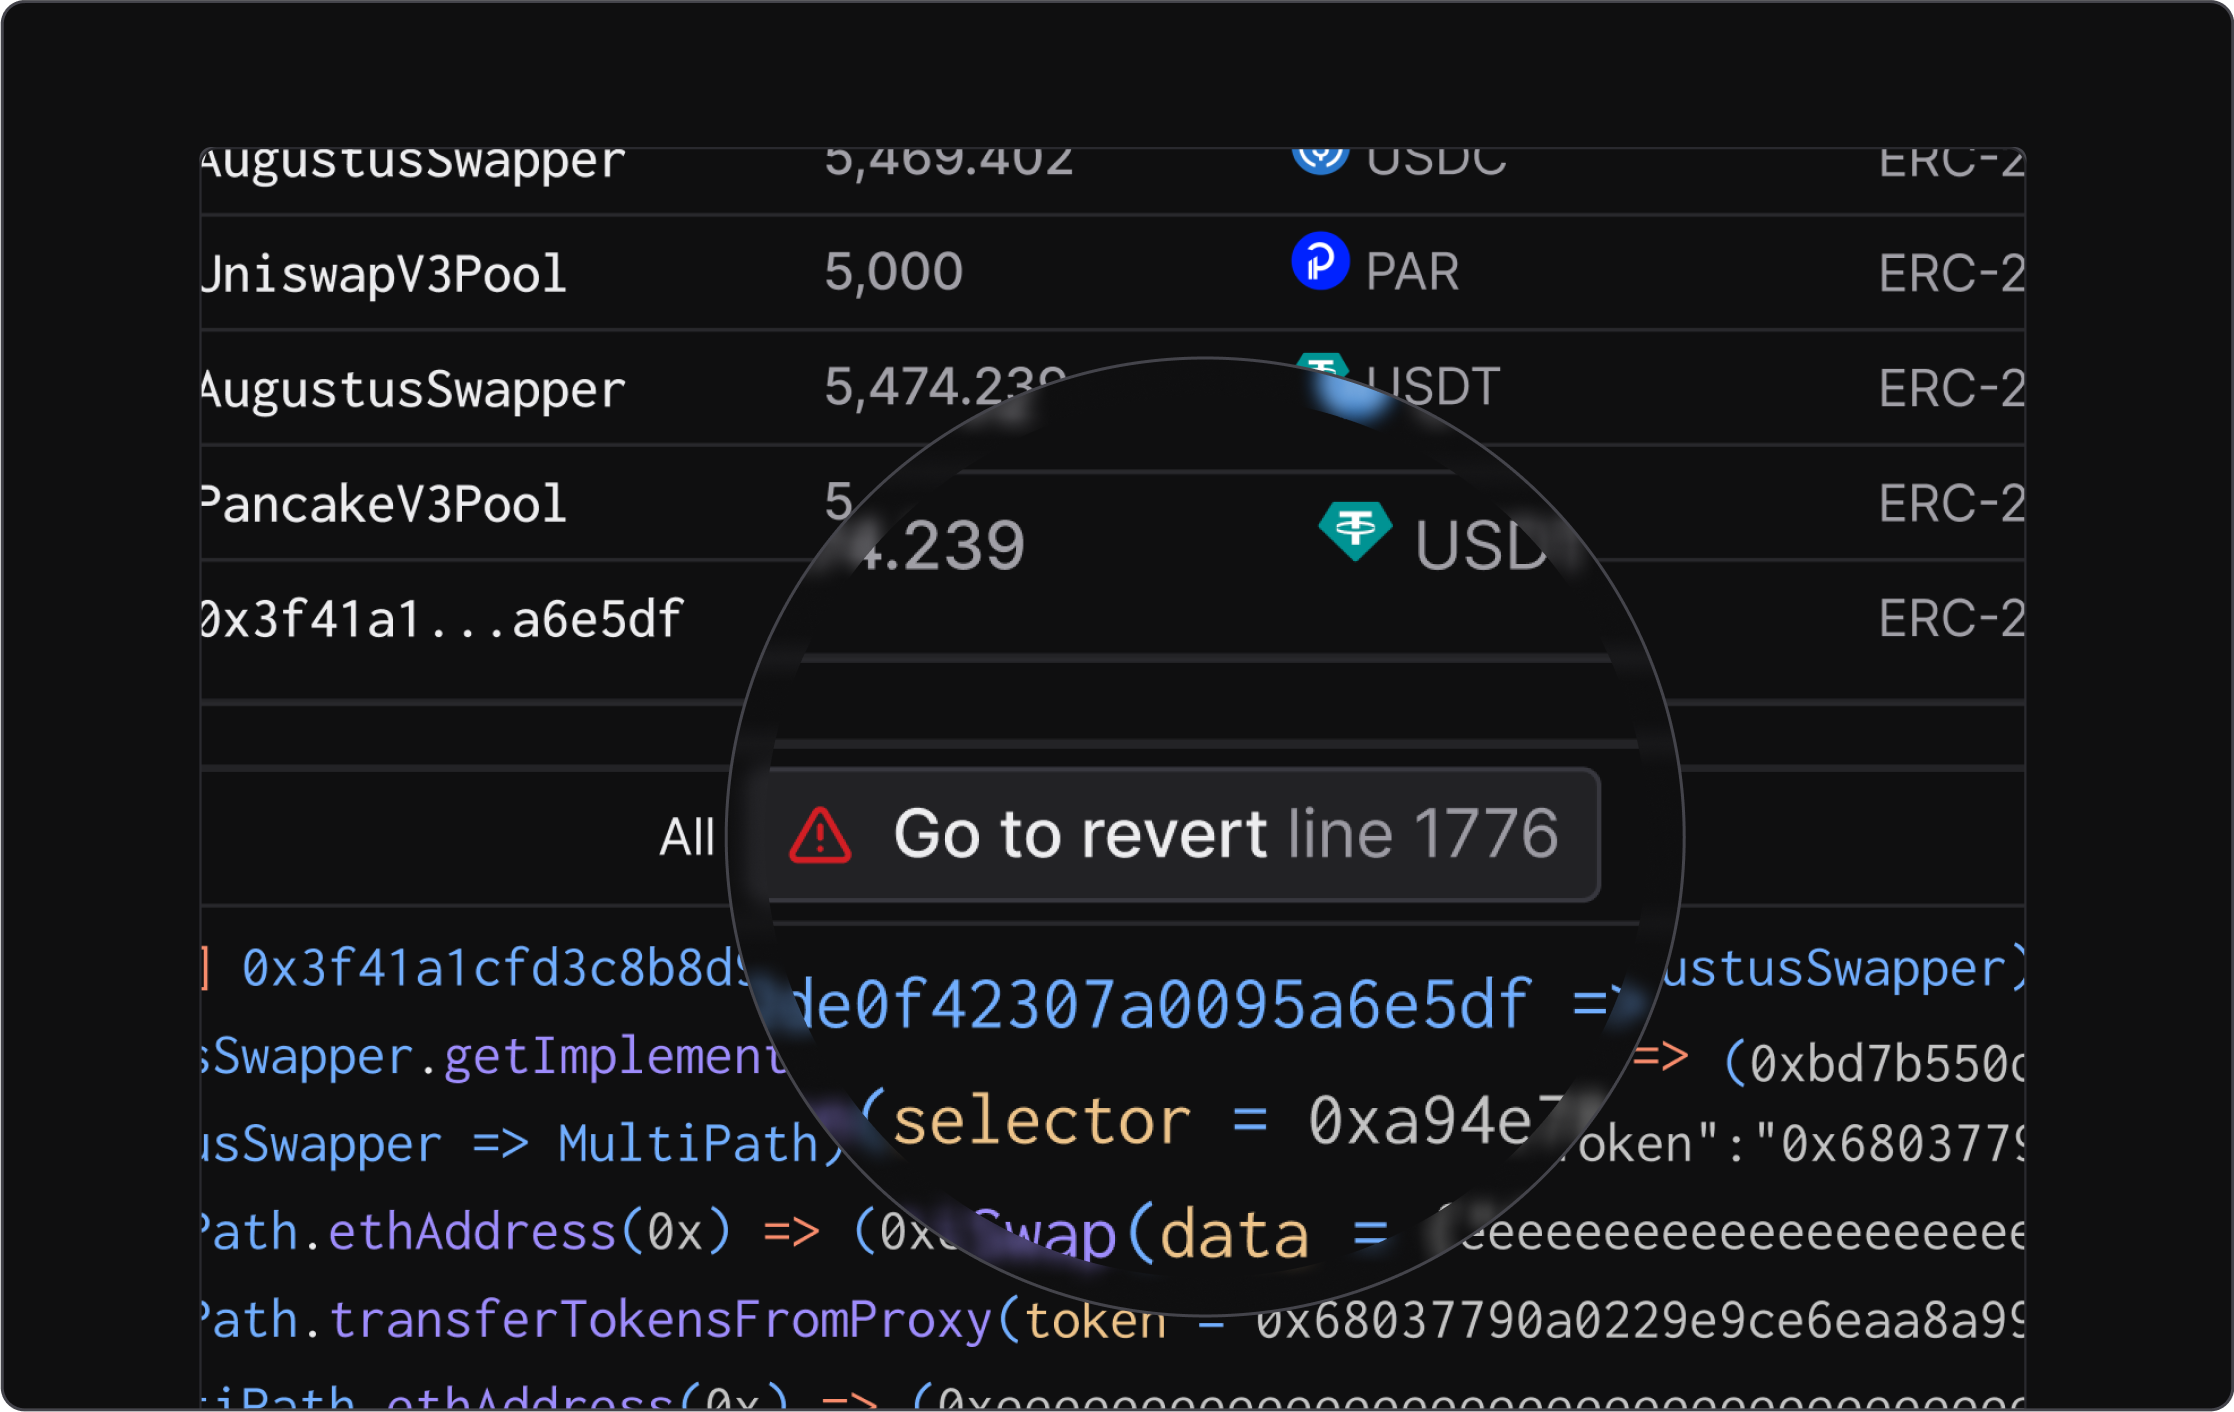
Reverts are now clearly displayed in the transaction execution header. Click and open a revert directly, jumping to the line of code where the error occurred.
Gas usage breakdown
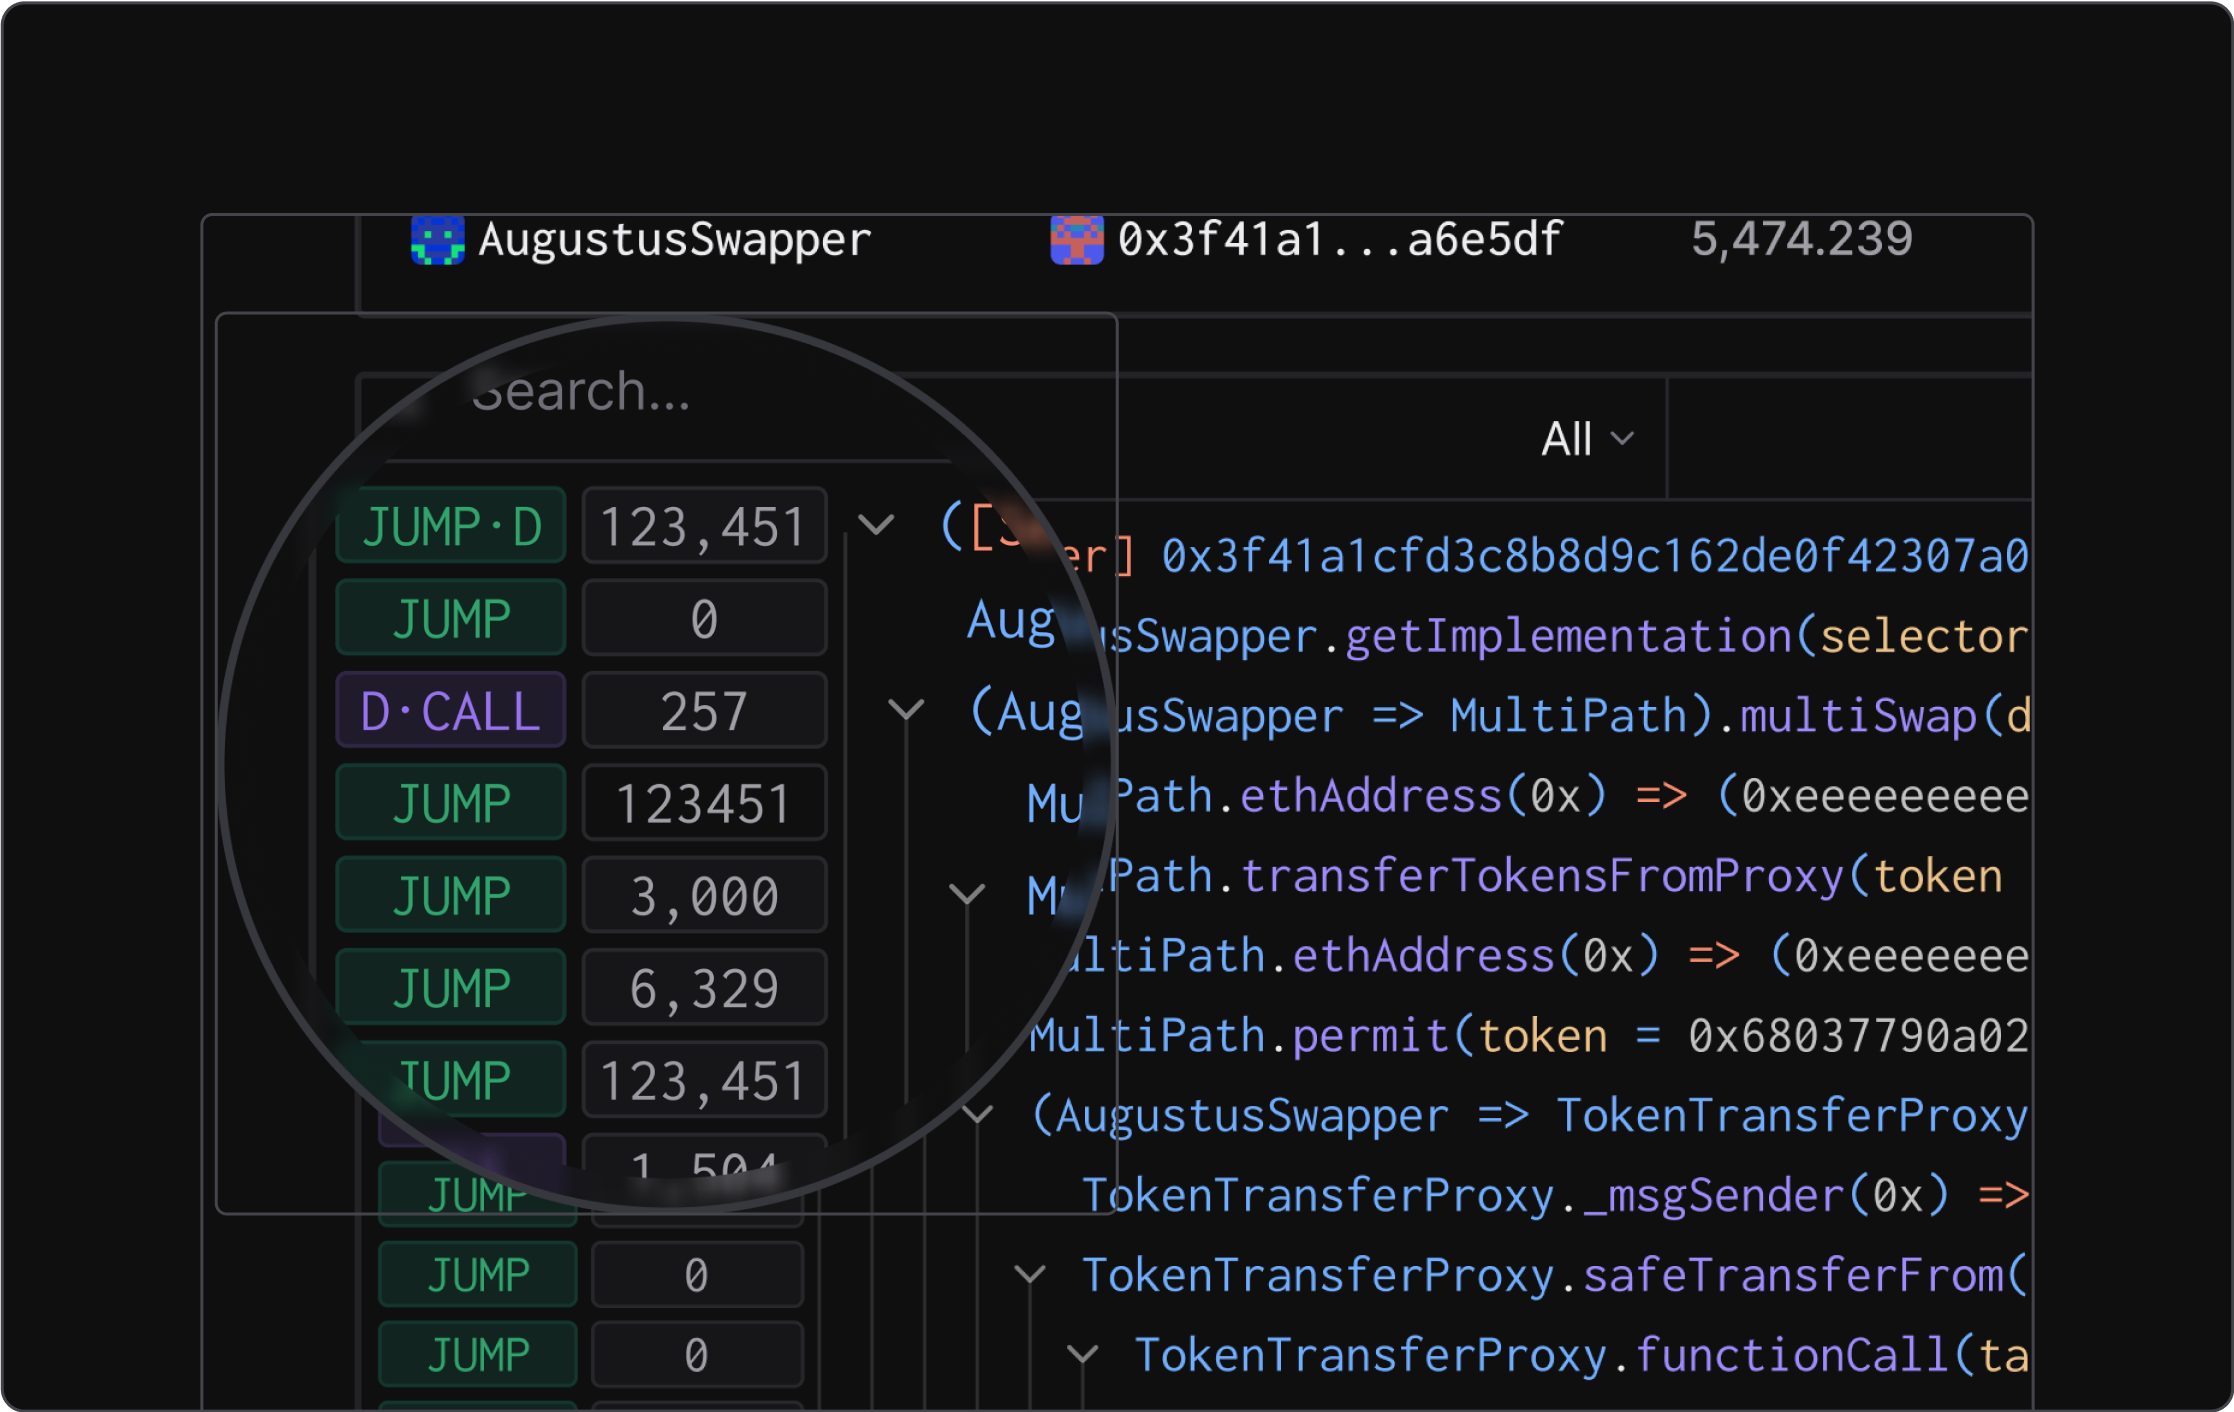
Gas consumption is now displayed directly in the transaction execution trace. You can see how much gas is used per function. Then, click and open Gas Profiler directly from the execution trace for an in-depth gas analysis.
Simplified transaction overview
The transaction receipt has been simplified, providing essential information about a transaction in an easily scannable way.
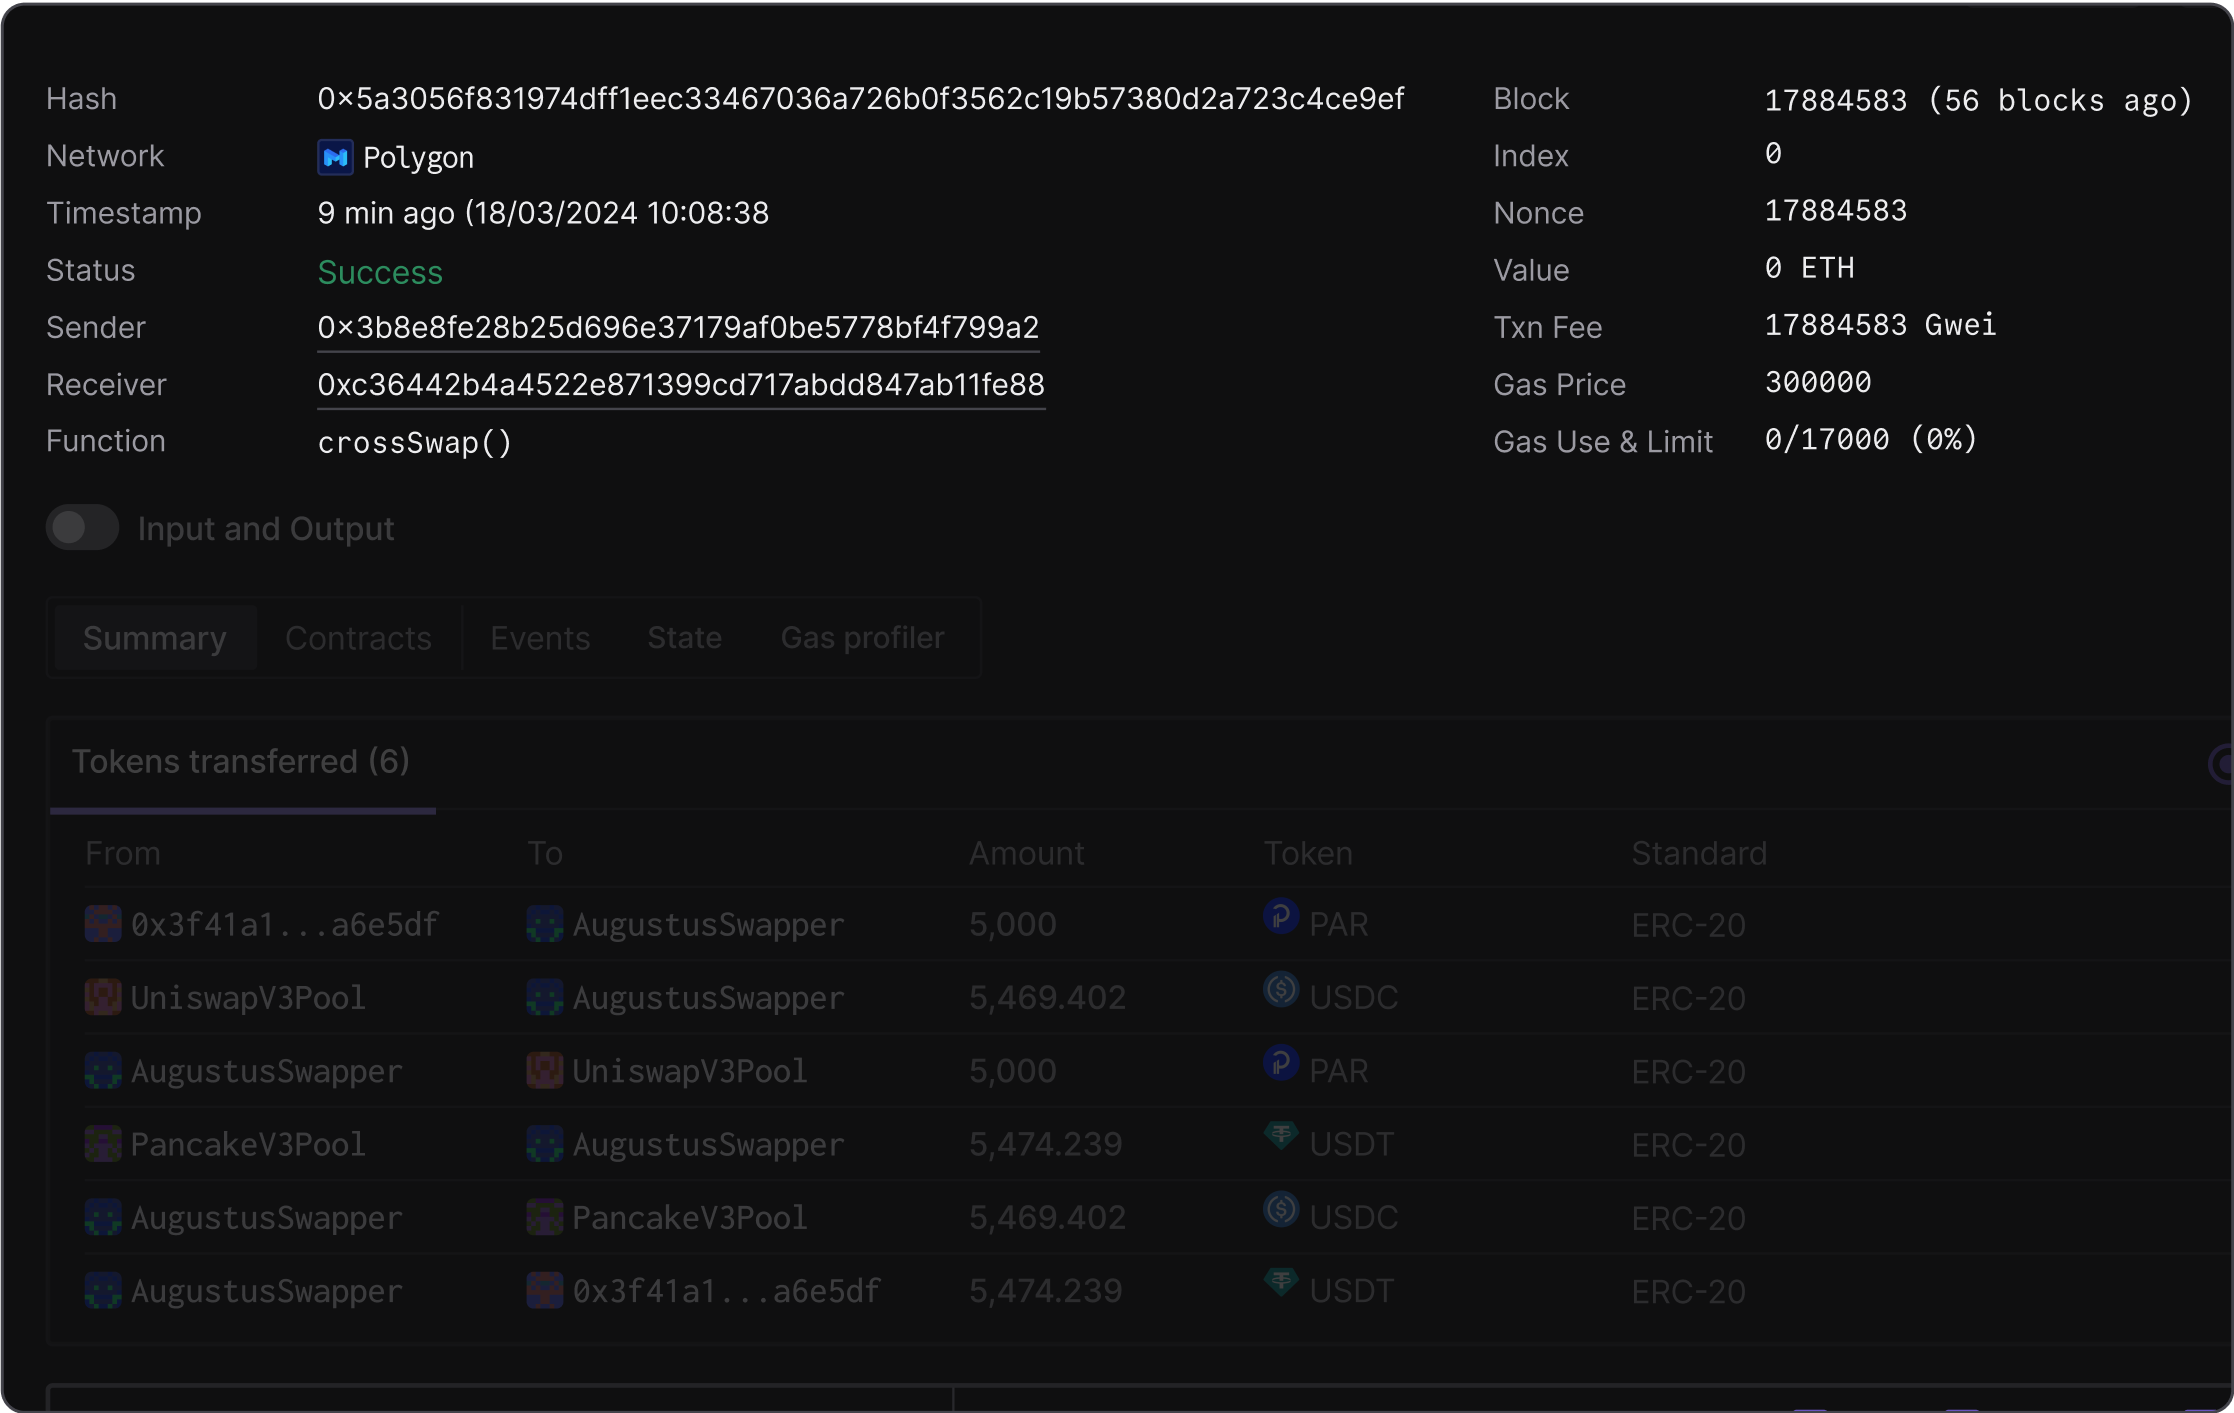
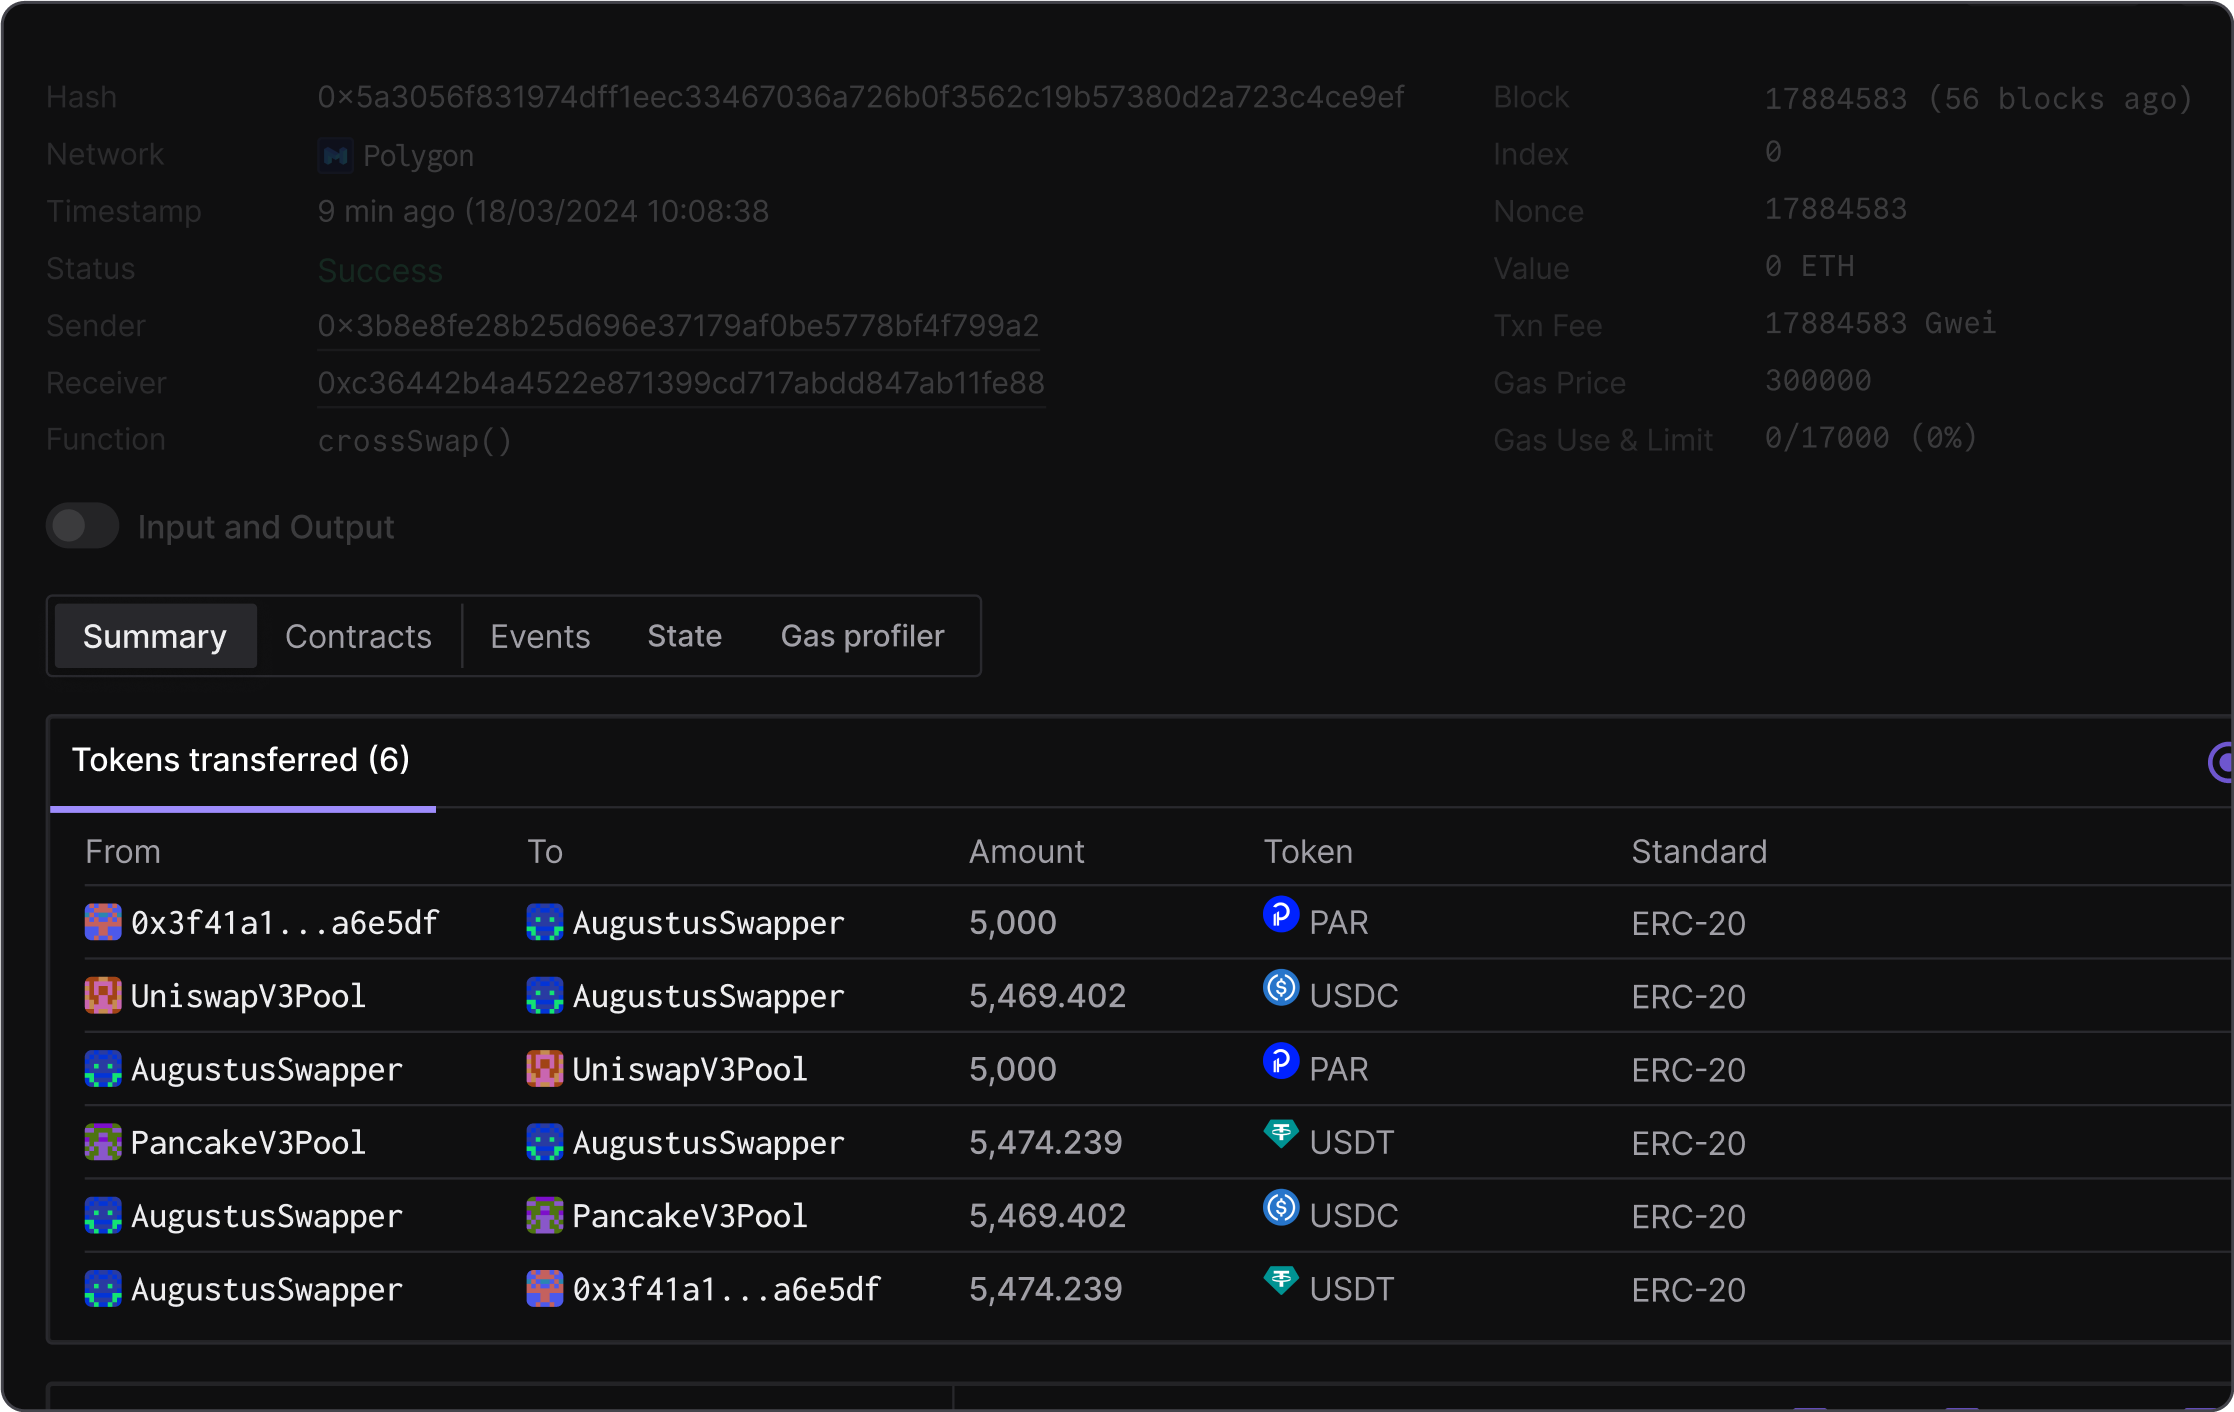
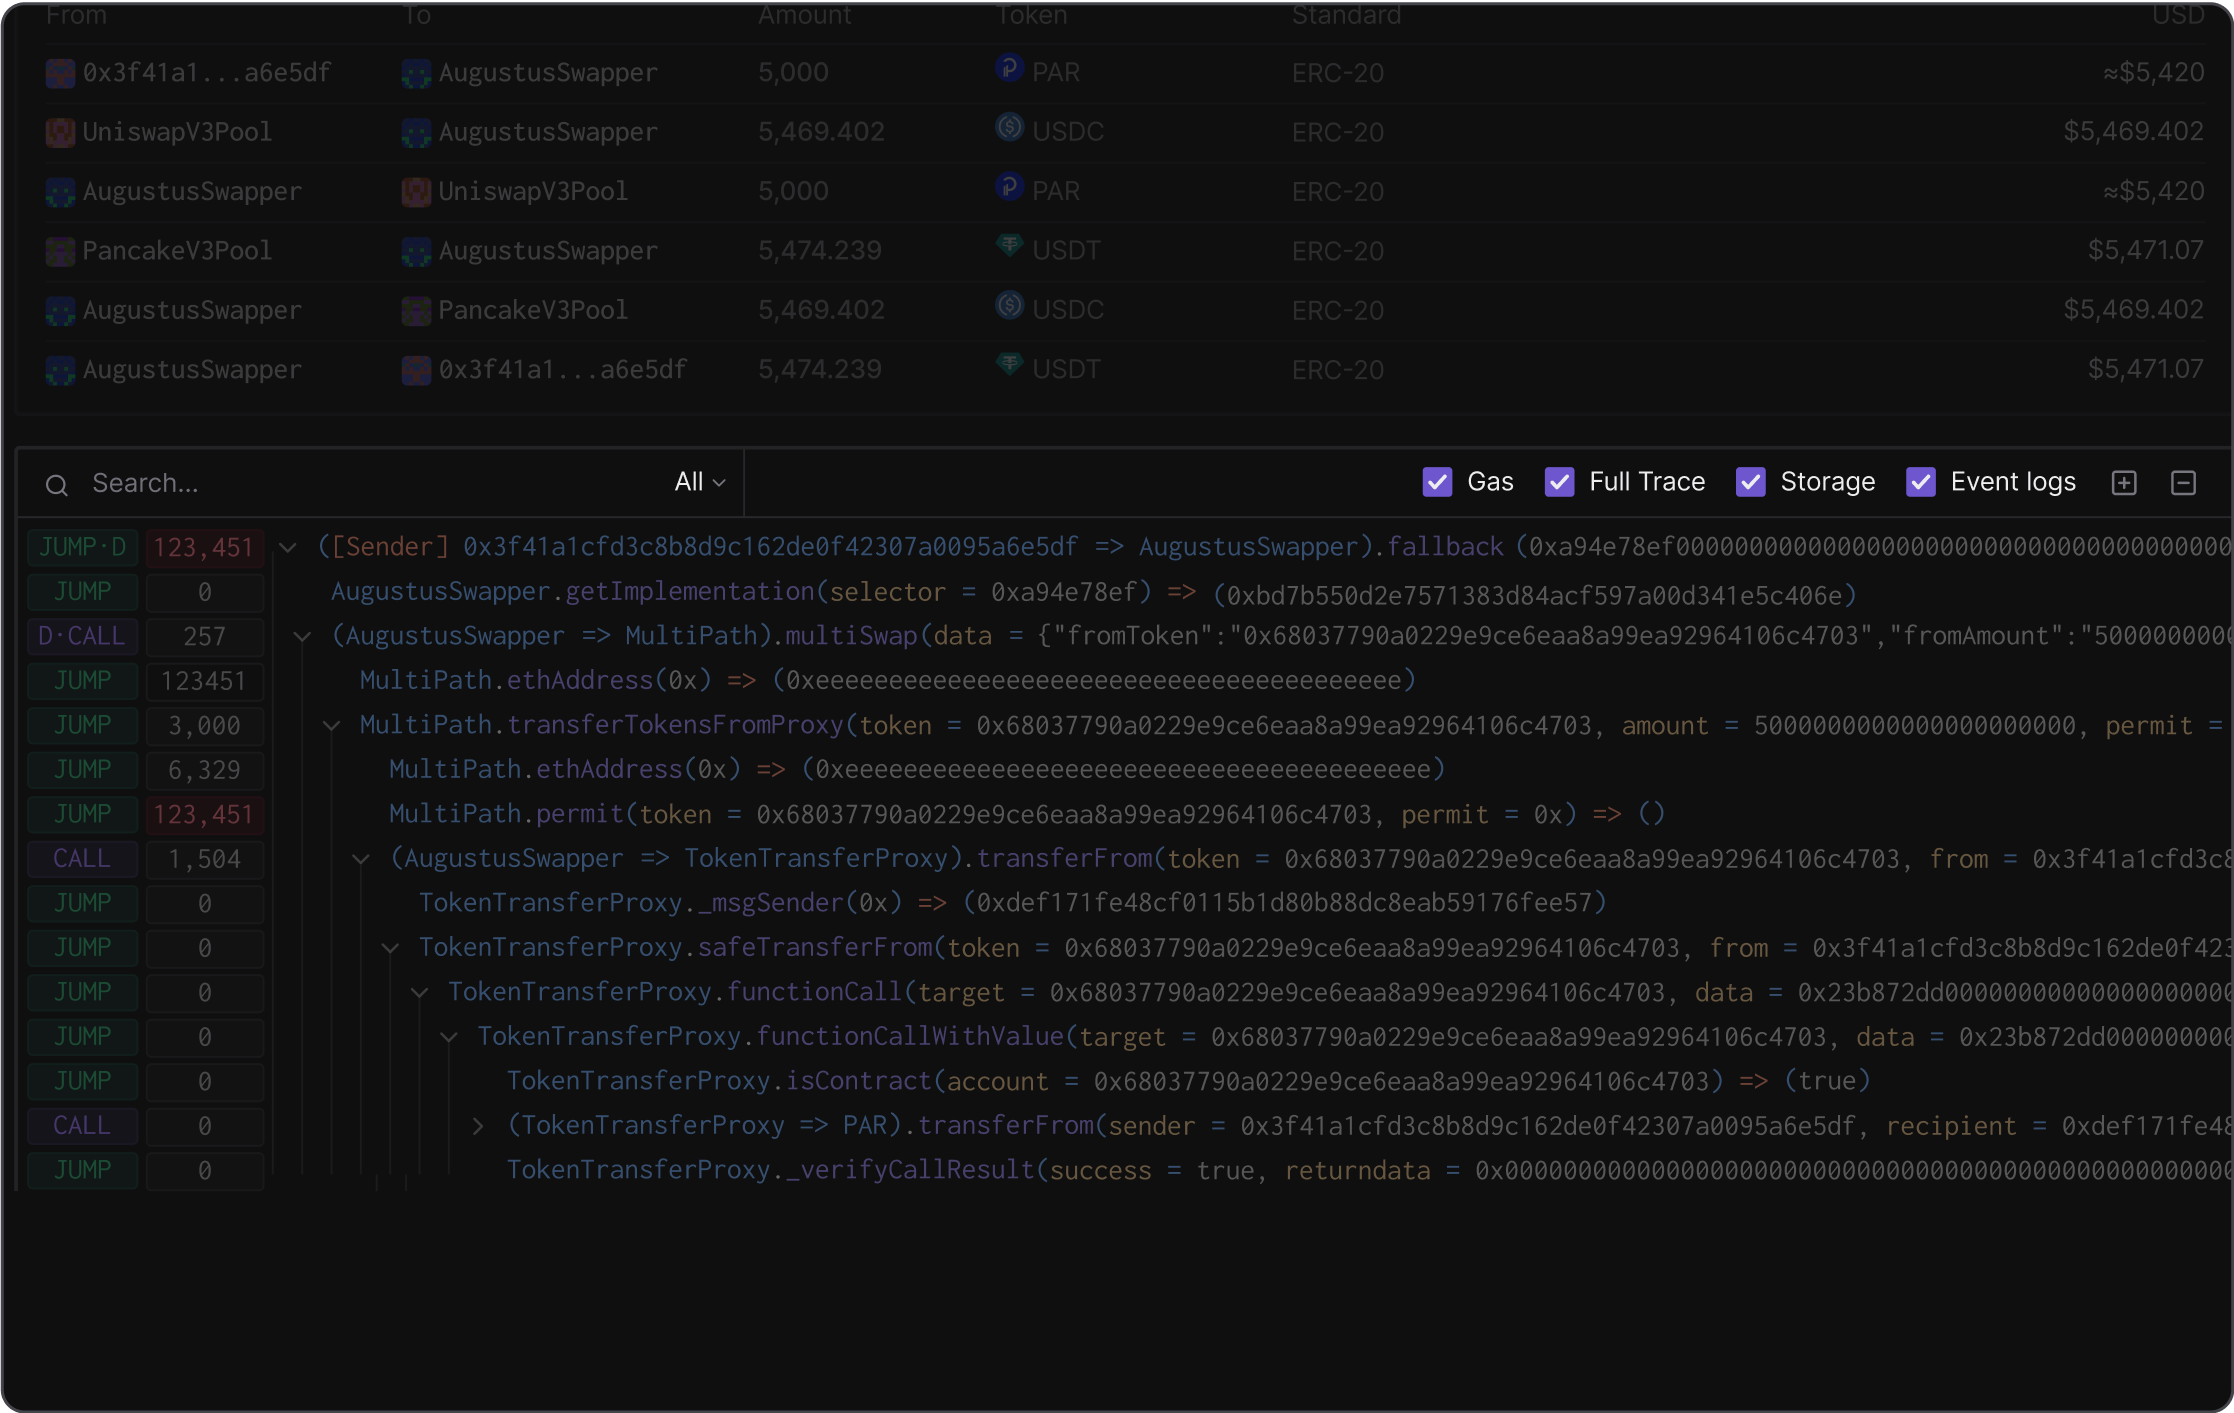
You can also find all details on transaction execution in a single place. Еasily navigate between and inspect transferred tokens, emitted events, state changes, and other details.
Finally, the trace header has also been updated to enable a fast and easy search from a single dropdown.
Debugger updates
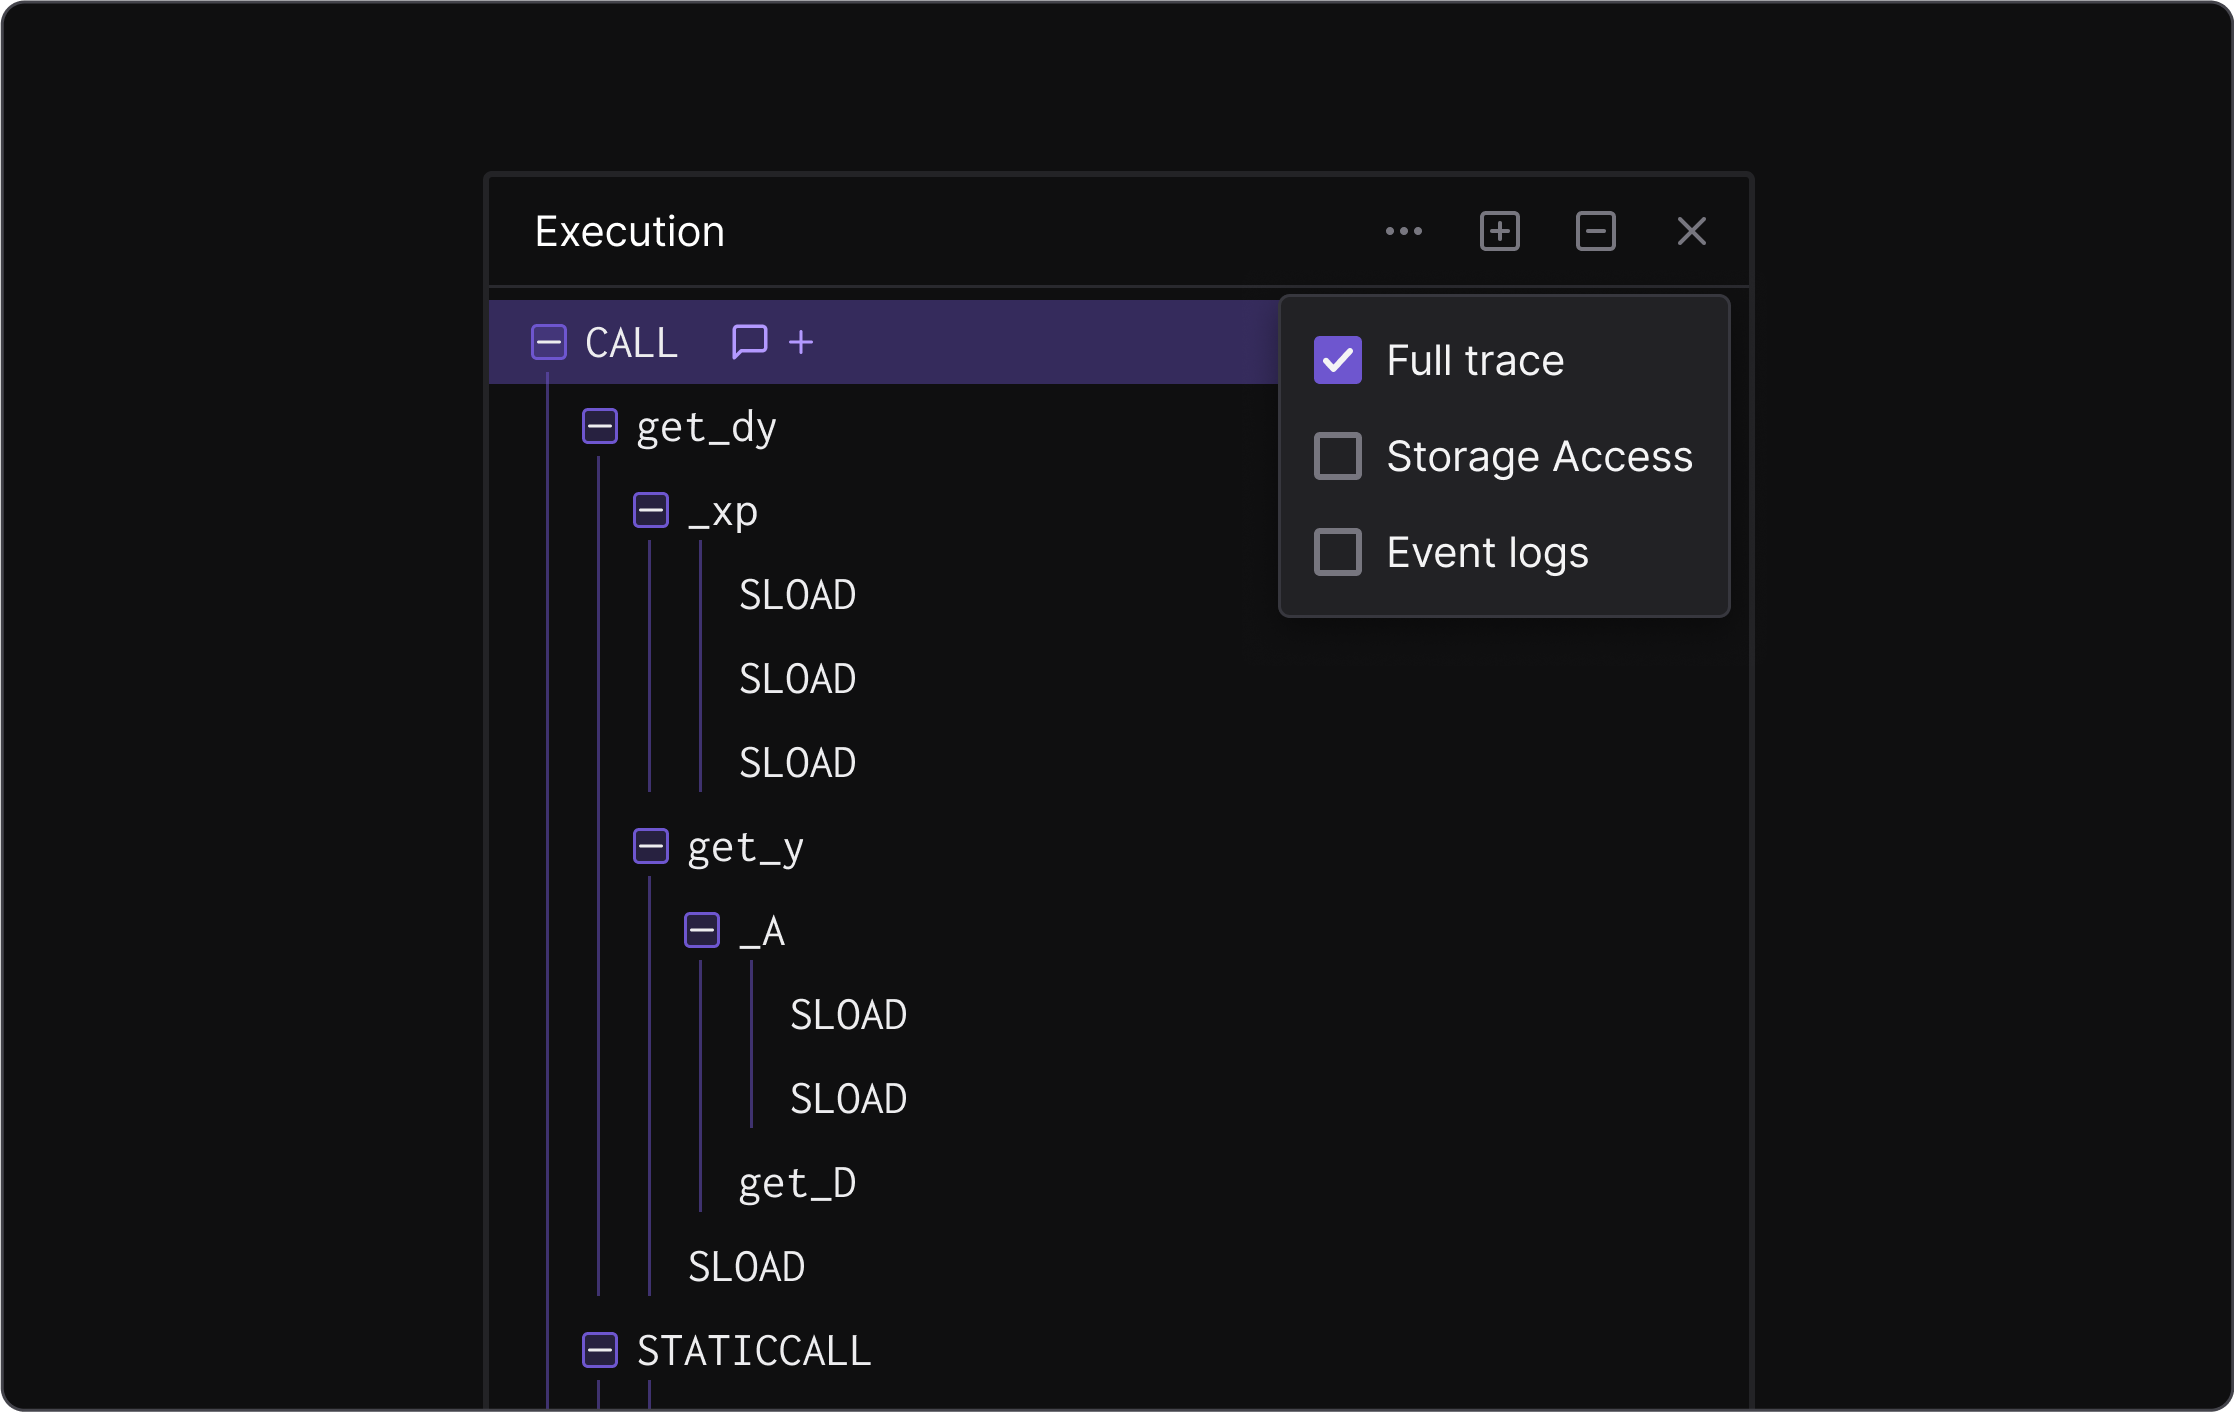
Storage access and event logs are now also available in the Debugger execution trace. Just check the boxes of the information you want to show in the trace and get a granular execution overview.
Head over to the Tenderly Dashboard to start exploring and debugging with ease!
